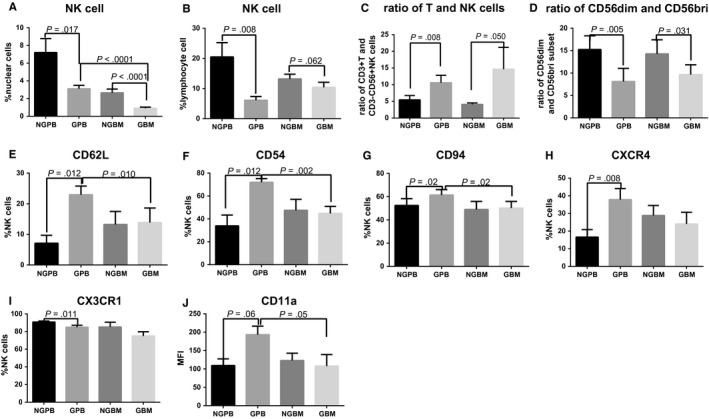
Figure 1.

Comparison of NK cells between NGPB and GPB, NGBM and GBM, and GBM and GPB. A and B show comparisons of the percentage of NK cells among nuclear cells (A) and lymphoid cells (B) (n = 15); C and D show the comparison of the ratio of T and NK cells (C) as well as the ratio of CD56dim and CD56bright NK cells (D) (n = 15); E, F, G, H, I and J show comparisons of the expression of CD62L (E), CD54 (F), CD94 (G), CXCR4 (H), CX3CR1 (I) and CD11a (J) on NK cells (n = 9). The data are shown as the mean ± SEM of the indicated number of donors
