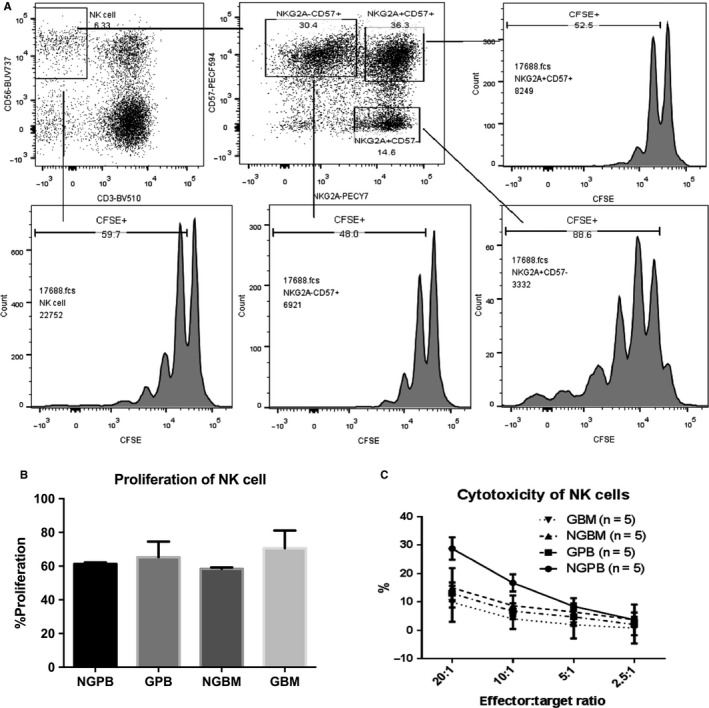
Figure 2.

Comparison of proliferation of NK cells between NGPB and GPB, NGBM and GBM, and GBM and GPB. A shows representative flow cytometry plots of the proliferation of CFSE‐labelled NK cells, NKG2A+ CD57− NK cells, NKG2A− CD57+ NK cells and NKG2A+ CD57+ NK cells; B shows the comparison of the proliferation of NK cells among NGPB, GPB, NGBM and GBM (n = 3); C shows the comparison of the cytotoxicity of purified NK cells against K562 cells (n = 5). The data are shown as the mean ± SEM of the indicated number of donors
