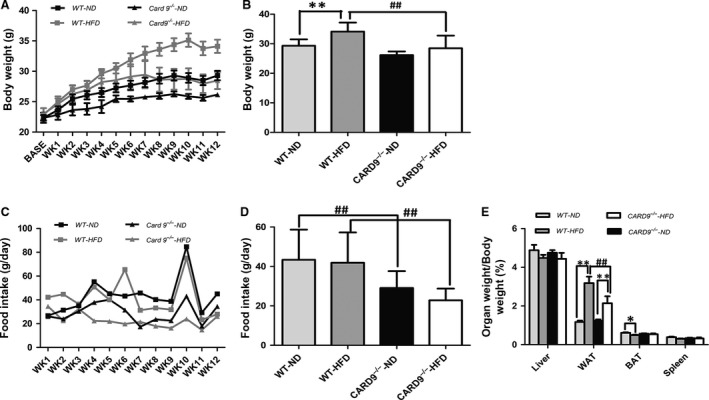
Figure 1.

Changes in body weight (b.w.), food intake and the ratio of organ/b.w in the CARD9−/− and WT mice after ND and HFD feeding. Weekly changes of b.w. (A), b.w. at the end of 12 weeks feeding (B), Weekly food intake (C),Average food intake during the entire experiment (D), The ratios of organ/b.w. in liver, WAT, BAT and spleen (E). *P < 0.05, **P < 0.01, HFD vs. ND; # P < 0.05, ## P < 0.01, CARD9−/− vs. WT.
