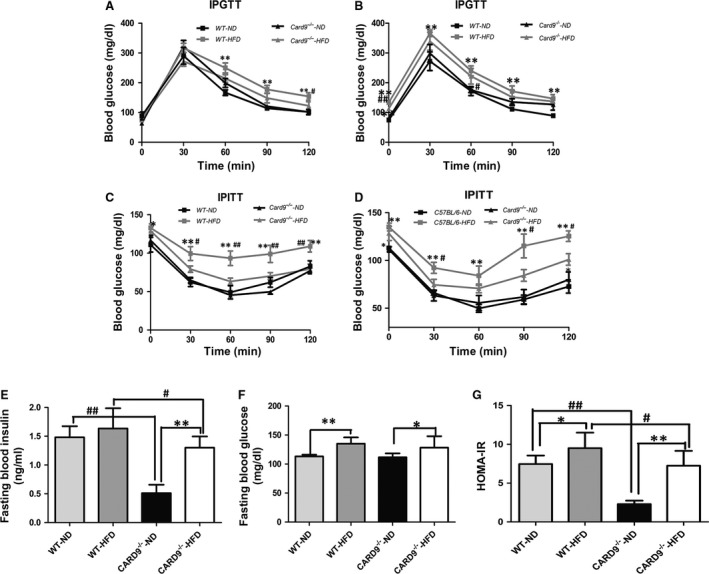
Figure 2.

Glucose homeostasis and insulin sensitivity in the CARD9−/− and WT mice at week 8 and 12. IPGTT at week 8 (A) and week 12 (B), IPITT at week 8 (C) and week 12 (D), Fasting blood glucose level (E), Fasting blood insulin level (F), HOMA‐IR index (G). *P < 0.05, **P < 0.01, HFD vs. ND; # P < 0.05, ## P < 0.01, CARD9−/− vs. WT.
