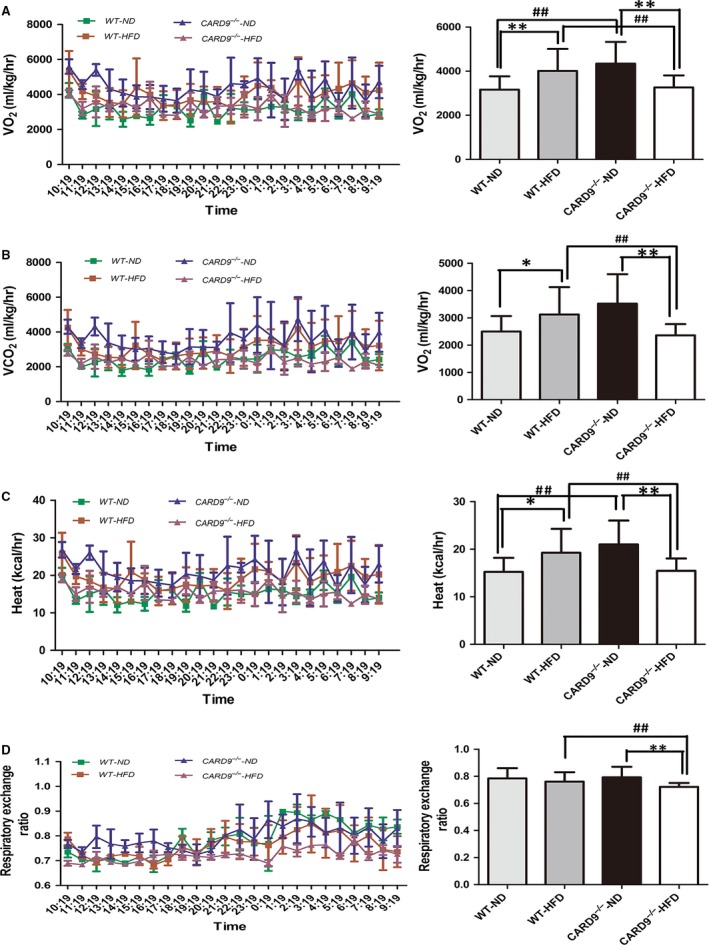
Figure 3.

Energy homeostasis in the CARD9−/− and WT mice after ND and HFD feeding. O2 consumption (A), CO 2 consumption (B), Heat production (C), Respiratory exchange ratio (D). Left panel: the trends of above four indicators with time, Right panel: the bar graph of above four indicators in the four groups, respectively. *P < 0.05, **P < 0.01, HFD vs. ND; # P < 0.05, ## P < 0.01, CARD9−/− vs. WT.
