Figure 1.

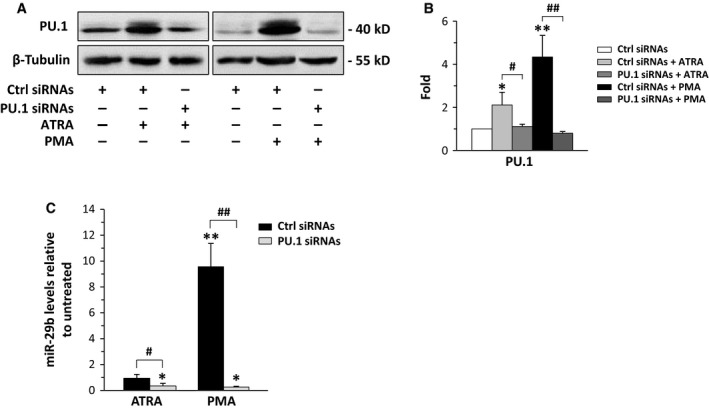
Modulation of PU.1 and miR‐29b levels in Kasumi‐1. (A) Representative Western blot analysis using the indicated antibodies of Kasumi‐1 cells in which PU.1 was down‐regulated during 72 h of all‐trans‐retinoic acid (ATRA) or phorbol 12‐myristate 13‐acetate (PMA) treatment. (B) Relative amounts of PU.1 as deduced from the densitometry of Western blot bands normalized with β‐Tubulin. Ctrl siRNAs: scramble siRNAs; PU.1 siRNAs: siRNAs specific for PU.1. The mean expression level of 3 separate experiments ±SD is shown. *P < .05, **P < .01 compared to respective controls (Ctrl siRNAs). (C) qRT‐PCR analysis of miR‐29b levels in Kasumi‐1 cells in which PU.1 was down‐regulated during treatment with ATRA or PMA. The values, obtained using the 2−∆∆ CT method, are shown as fold changes relative to the untreated condition and represent the means of 3 separate experiments ±SD. *P < .05, **P < .01 compared to untreated conditions. # P < .05, ## P < .01
