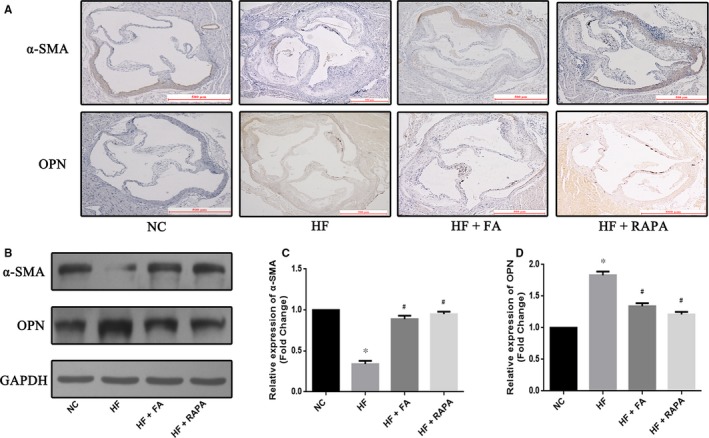
Figure 3.

Effect of folic acid on vascular smooth muscle cell dedifferentiation. (A) Representative immunohistochemistry images showing protein expression of α‐smooth muscle actin (SMA) and osteopontin (OPN) in the thoracic aorta; (B) (C) (D) Western blot analyses show the expression of α‐SMA and OPN, and quantifiable results of Western blot analyses. Scale bar = 500 μm. The values are expressed as the mean±standard error of the mean (n = 5 for each group). *P < .05 vs the NC group; # P < .05 vs the HF group
