
Figure 4.
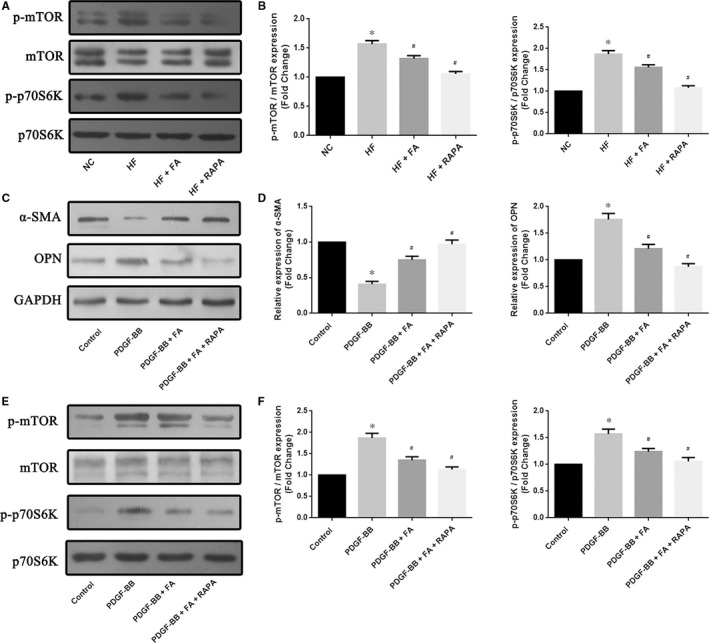
Effect of folic acid on the mTOR/p70S6K signalling pathway in vivo and in vitro. (A) (B) Western blot analyses show the expression of the phosphorylation of mammalian target of rapamycin (mTOR) and p70S6K in vivo, and quantifiable results of Western blot analyses; (C) (D) Western blot analyses show the expression of α‐SMA and osteopontin (OPN) in vascular smooth muscle cells (VSMCs), and quantifiable results of Western blot analyses; (E) (F) Western blot analyses show the expression of the phosphorylation of mammalian target of rapamycin (mTOR) and p70S6K in vitro, and quantifiable results of Western blot analyses. The values are expressed as the mean±standard error of the mean (n = 5 for each group). *P < .05 vs the NC group; # P < .05 vs the HF group