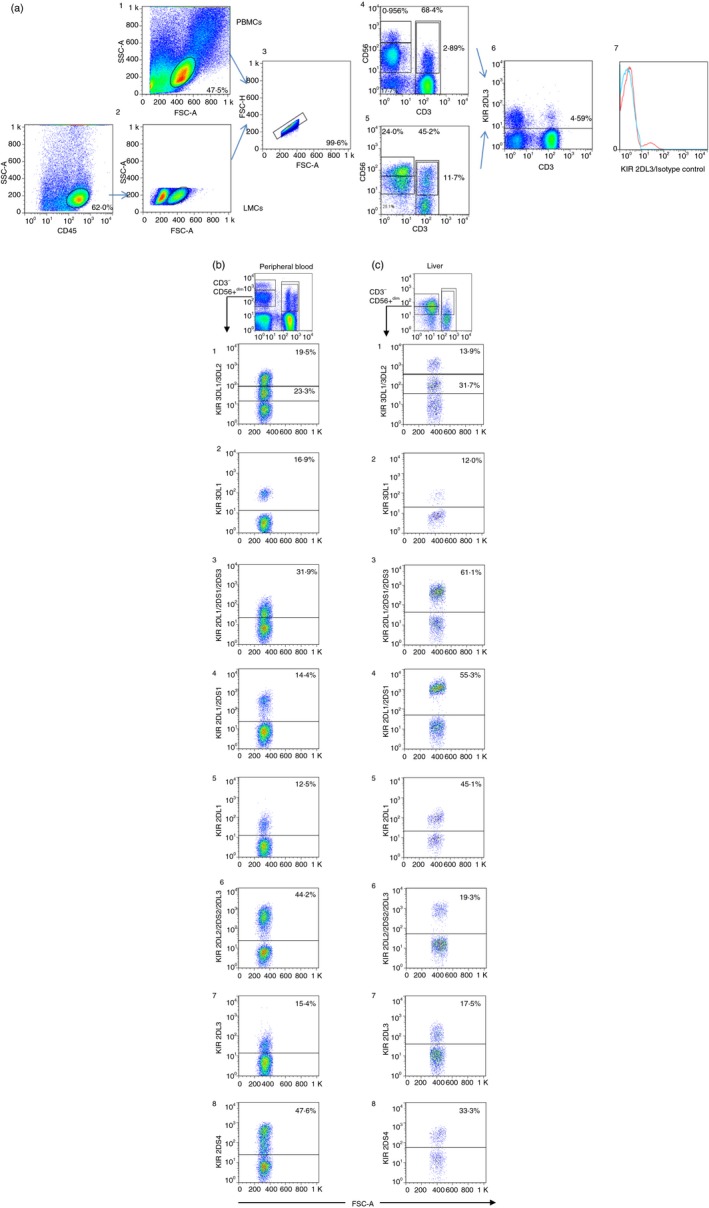
Figure 8.

(a) Dot plots showing the strategy used to analyse the expression of killer cell immunoglobulin‐like receptors (KIRs) in peripheral blood (1) and liver CD45+ cells (2) deduced from FSC/SSC, Doublets were discarded (3). CD56bright, CD56dim, natural killer T (NKT) and T‐cell populations were selected in peripheral blood mononuclear cells (PBMCs) (4) and liver mononculear cells (LMCs) (5). (6) Illustrates an example of KIR2DL3 expression on total PBMCs and (7) after the subtraction of its isotype control. (b,c) The gating strategy for peripheral blood and liver NK, NKT and T cells. The following figures illustrate the KIR staining pattern of the different antibodies on CD56+ CD3− NK cells obtained from a single individual (one sample for peripheral blood and another sample for liver). b1 and c1 illustrate the staining pattern of the anti‐KIR3DL1/3DL2 antibody. The antibody showed two clouds with different mean fluorescence intensity values, where the lower cloud corresponds to 3DL2 and the upper cloud corresponds to 3DL1. The staining with anti‐KIR3DL1 shown in b2 and c2 confirmed that the frequency in the expression of the KIR 3DL1 antibody correlated with the upper cloud detected by the anti‐KIR3DL1/3DL2 antibody. The expression of 2DS3 was deduced from subtraction of expression between 2DL1/2DS1/2DS3, as shown in b3 and c3, and frequency of the expression of the anti‐2DL1/2DS1 illustrated in b4 and c4. Notably, expression of 2DL1/2DS1 in the liver sample showed a small difference with 2DL1/2DS1/2DS3 because the genotyping of this sample revealed the absence of the 2DS3 gene. b5 and c5 illustrates the expression of 2DL1 in peripheral blood and liver, respectively. b6 and c6 shows the expression of 2DL2/2DS2/2DL3, which can be compared with the expression of 2DL2/2DS2 obtained from subtraction of the signal detected using the anti‐2DL3 antibody (b7 and c7). b8 and c8 shows the expression of KIR2DS4. In all cases, the presence of the KIR genes was verified. [Colour figure can be viewed at http://www.wileyonlinelibrary.com
