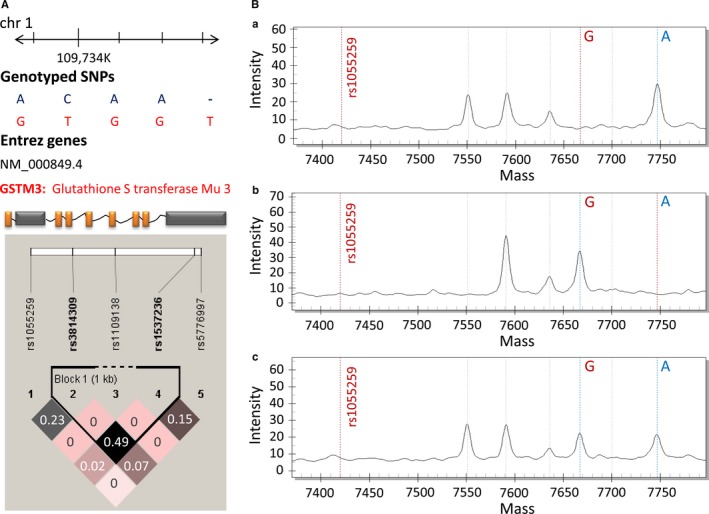
Figure 1.

The linkage disequilibrium (LD) plot of SNPs in GSTM3 gene and representative MALDI‐TOF MS spectra of rs1055259. (A) Pairwise LD among 5 candidate SNPs of GSTM3. The r2 value is shown in each diamond. It indicates the pairwise correlation between SNPs. The colour scale ranges white to black reflect lower to higher r2 values. (B) Genotypes of rs1055259 are confirmed by plotting peak intensity (y‐axis) against mass (Da) (x‐axis). (a) MALDI‐TOF MS spectrum of a single peak at 7748.5 Da represents homozygous genotype of AA. (b) MALDI‐TOF MS spectrum of a single peak at 7667.0 Da indicates homozygous genotype of GG. (c) MALDI‐TOF MS spectrum of 2 peaks at 7748.5 Da and 7667.0 Da indicates heterozygous genotype of AG
