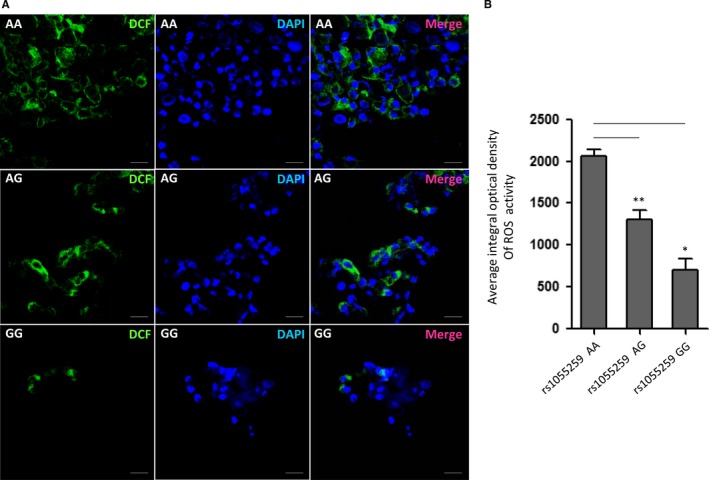
Figure 4.

Reactive oxygen species (ROS) activity in ccRCC primary cells with different genotype of rs1055259. (A) Representative confocal‐microscopy graphs of ROS activity in rs1055259 AA, AG and GG cells incubated with DCFH‐DA (it could be ROS‐oxidized to DCF, which presented green fluorescence). (B) Quantitative analysis of ROS activity in different group. The experiment was repeated at least 3 times. Data were presented as mean ± S.D. Scale bar: 50 μm. *P < .05, **P < .01
