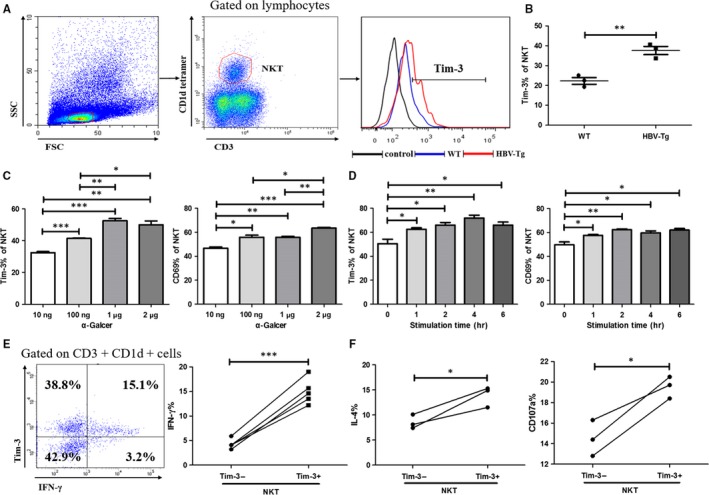
Figure 1.

Tim‐3 expression was associated with iNKT cells activation. IHLs were separated and analysed by flow cytometry. Gated on CD3+ CD1d+ iNKT cells, the expression of Tim‐3 was analysed (A) and compared between HBV‐Tg mice and WT controls (B) (n = 3). IHLs were stimulated with α‐Galcer at different concentrations (C) or stimulated with 1 μg/mL α‐Galcer for indicated time (D), and the expression of Tim‐3 and CD69 on iNKT cells was analysed. IHLs were stimulated with 1 μg/mL α‐Galcer for 6 h, and the expression of IFN‐γ (E) (n = 5), IL‐4 and CD107a (F) (n = 3) in iNKT cells was detected and compared between Tim‐3+ iNKT and Tim‐3‐iNKT cells. Data were analysed using paired or unpaired Student's t test. For all graphs: P < .05 (∗), P < .01 (∗∗) or P < .001 (∗∗∗) was considered as significant
