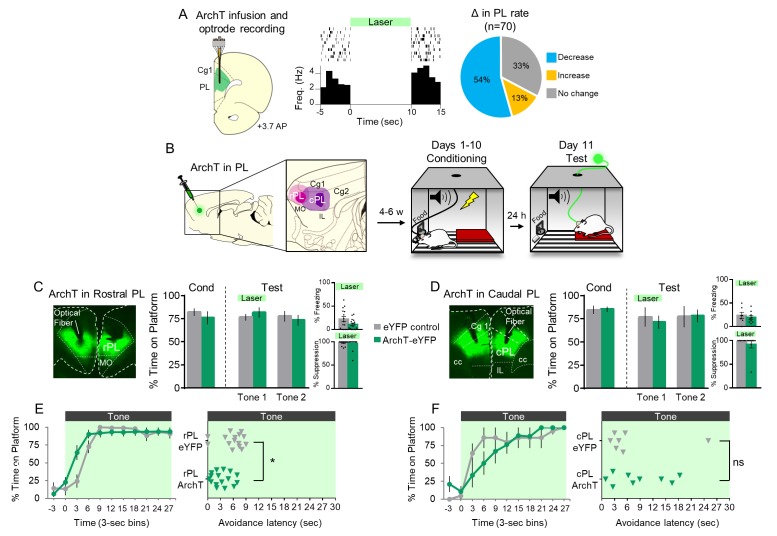
Figure 2. Optogenetic silencing of prelimbic neurons does not delay avoidance.
(A). Left: Schematic of ArchT expression and optrode placement in anesthetized rats (n = 2). Middle: Rasters and peristimulus time histogram of a single PL neuron showing a decrease in firing rate during laser illumination (8–10 mW, 532 nm, 10 s ON, 10 s OFF, 10 trials). Right: Proportion of PL neurons that exhibited a decrease (blue, n = 38), increase (gold, n = 9), or no change (grey, n = 23) in firing rate. (B). Schematic of virus infusion, location of min/max expression of AAV in rPL (pink) and cPL (purple), followed by avoidance training and test. At Test, 532 nm light was delivered to rPL or cPL during the entire 30 s tone presentation (Tone 1). (C). Left: Micrograph of ArchT expression and optical fiber placement in rPL. Right: Percent time on platform at Cond (Day 10, Tone 1) and Test (Day 11, Tone 1 with laser ON and Tone 2 with laser OFF) for rPL-eYFP control (n = 15, grey) and rPL-ArchT rats (n = 17, green). Inset: There was no effect of rPL photosilencing (Tone 1 at Test) on freezing (top) and percent suppression of bar pressing (bottom) during the tone (unpaired t-test). (D). Left: Micrograph of ArchT expression and optical fiber placement in cPL. Right: Percent time on platform during Cond and Test for cPL-eYFP control (n = 7, grey) and cPL-ArchT rats (n = 9, green). Inset: There was no effect of cPL photosilencing (Tone 1 at Test) on freezing (top) and percent suppression of bar pressing (bottom) during the tone (unpaired t-test). (E). Left: Time spent on platform in 3 s bins (Tone 1 at Test) revealed no effect of silencing rPL-ArchT neurons compared to eYFP controls (repeated measures ANOVA). Right: Latency of avoidance for each rat (Tone 1 at Test). rPL-ArchT rats showed a decrease in avoidance latency (Mann Whitney U test, p=0.021). (F). Timeline of avoidance (left) and latency (right) for cPL-eYFP control rats and cPL-ArchT rats. All data are shown as mean ± SEM; *p<0.05.
Figure 2—figure supplement 1. Assessment of fear following ArchT silencing of rPL neurons.


