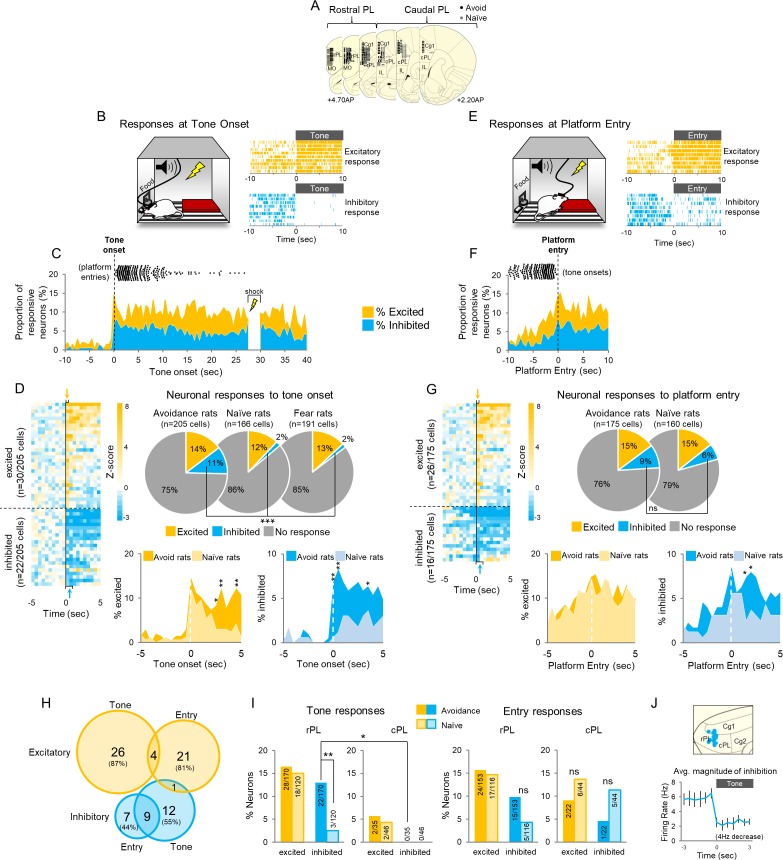
Figure 3. Active avoidance is correlated with inhibition in rostral PL neurons.
(A). Location of recordings across PL (n = 6 avoidance-trained and n = 8 naïve rats). (B). Left: Schematic of rat behavior at tone onset during unit recordings. Right: single unit examples of excitatory (gold rasters) and inhibitory (blue rasters) tone responses. Each row represents a single trial. (C). Proportion of excitatory (gold) or inhibitory (blue) neurons at each 500 ms bin across the tone. Time of platform entry (black dots), for all successful trials (n = 284) in avoidance rats is indicated relative to tone onset. (D). Left: Heat map of normalized (z-score) responses to tone onset (Time = 0 s) of neurons in avoidance rats. Each row represents one neuron, bin = 0.5 s. Arrows indicate bins used to determine excitatory (gold, first 500 ms bin), or inhibitory (blue, first or second 500 ms bin) tone responses. Right: Pie charts showing proportions of excited, inhibited, or non-responsive neurons at tone onset in avoidance (n = 30, 22, 153, respectively), naïve (n = 20, 3, 143, respectively), and fear conditioned (n = 25, 3, 163, respectively) rats. Proportions of inhibitory responses were significantly greater in avoidance rats compared to naïve and fear conditioned rats (Chi Square test). Bottom: Percentage of cells that were excited in avoidance (gold) or naïve (light gold) rats (left) or inhibited in avoidance (blue) or naïve (light blue) rats (right) around tone onset (Fisher exact tests). (E). Left: Schematic of rat entering platform after tone onset during unit recordings. Right: single unit examples of excitatory (gold rasters) and inhibitory (blue rasters) platform entry responses. (F). Proportion of excitatory (gold) or inhibitory (blue) neurons at platform entry. Time of tone onset (black dots), for all successful trials (n = 284) in avoidance rats is indicated relative to platform entry. (G). Left: Heat map of normalized responses to platform entry (Time = 0 s) of neurons in avoidance rats. Right: Pie charts showing proportions that were excited, inhibited, or non-responsive neurons at platform entry in avoidance (n = 26, 16, 133, respectively) and naïve rats (n = 23, 10, 127, respectively). Bottom: Percentage of cells that were excited in avoidance (gold) or naïve (light gold) rats (left) or inhibited in avoidance (blue) or naïve (light blue) rats (right) after platform entry (Fisher exact tests). (H). Venn diagram illustrating the number (and percentage) of excitatory and inhibitory responsive cells responding to tone onset, platform entry, or both. (I). Left: Proportion of neurons responding to tone onset in rostral PL (left) and caudal PL (right) in avoidance (dark bars) and naïve (light bars) groups. There were significantly more inhibitory tones responses in rPL vs cPL (Fisher Exact test). Right: Proportion of neurons responding to platform entry in rostral PL (left) and caudal (right) PL in avoidance and naïve rats. (J). Top: Sagittal view of location of inhibitory tone responsive neurons (blue). Bottom: Average inhibitory response of neurons decreased from a baseline firing rate of 5.8 Hz to 1.98 Hz at tone onset. Data are shown as mean ± SEM; *p<0.05, **p<0.01, ***p<0.001.


