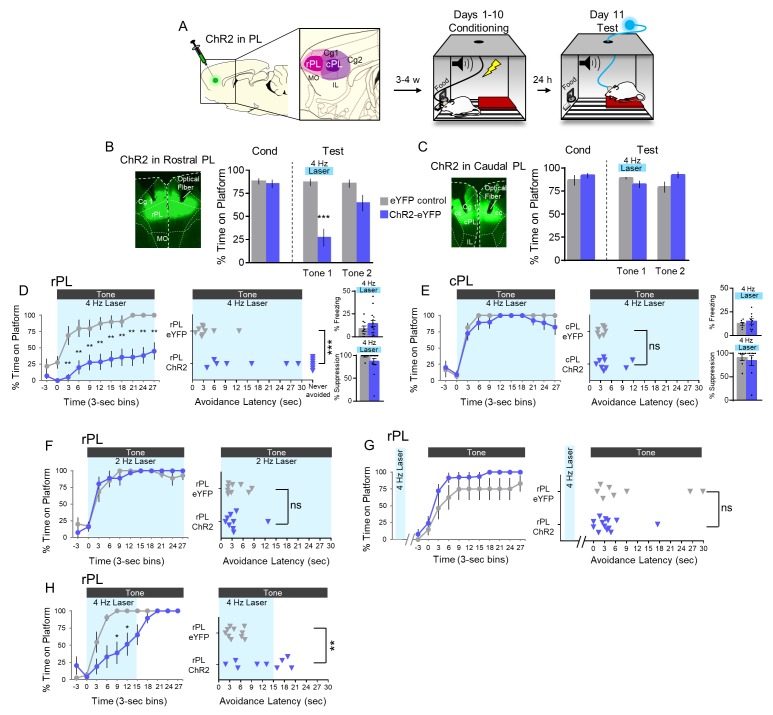
Figure 5. 4 Hz photoactivation of neurons in rostral PL delays or prevents avoidance.
(A). Schematic of viral infusion and location of min/max spread of AAV expression in rPL (pink) and cPL (purple), followed by avoidance training. At Test, 473 nm light was delivered to rPL or cPL during the 30 s tone presentation (Tone 1). (B). Left: Micrograph of ChR2 expression and optical fiber placement in rPL. Right: Percent time on platform at Cond (Day 10, Tone 1) and Test (Day 11, Tone 1 with laser ON and Tone 2 with laser OFF) for rPL-eYFP control rats (grey, n = 9) and rPL-ChR2 rats (blue, n = 14). (C). Left: Micrograph of ChR2 expression and optical fiber placement in cPL. Right: Percent time on platform during Cond and Test for cPL-eYFP control rats (grey, n = 7) and cPL-ChR2 rats (blue, n = 9). (D). Left: Time spent on platform in 3 s bins (Tone one at Test) revealed that rPL-ChR2 rats were significantly delayed in their avoidance compared to eYFP controls (repeated measures ANOVA, post hoc tukey). Right: Latency of avoidance for each rat (Mann Whitney U test, Tone 1 at Test). 7/14 rats never avoided. Inset: There was no effect of rPL photoactivation (Tone 1 at Test) on freezing (top) and percent suppression of bar pressing (bottom) during the tone (unpaired t-test). (E). Timeline of avoidance (left) and latency (right) for ChR2-cPL rats and eYFP controls revealed no effect of 4 Hz photoactivation of cPL. Inset: There was no effect of cPL photoactivation (Tone 1 at Test) on freezing (top) and percent suppression of bar pressing (bottom) during the tone (unpaired t-test). (F). Timeline of avoidance (left) and latency (right) for rPL-ChR rats (blue, n = 9) and rPL-eYFP controls (grey, n = 9) revealed no effect of 2 Hz photoactivation. (G). Timeline of avoidance (left) and latency (right) for rPL-ChR2 rats (blue, n = 13) and rPL-eYFP controls (grey, n = 8) revealed no effect of 4 Hz photoactivation (30 s) during the ITI period. (H). Timeline of avoidance (left) and latency (right) for and rPL-ChR2 rats (blue, n = 9) and rPL-eYFP controls (grey, n = 10) revealed a delay in avoidance with 4 Hz photoactivation during the first 15 s of the tone (Mann Whitney U test for time course and avoidance latency). All data are shown as mean ± SEM; *p<0.05; **p<0.01; ***p<0.001.
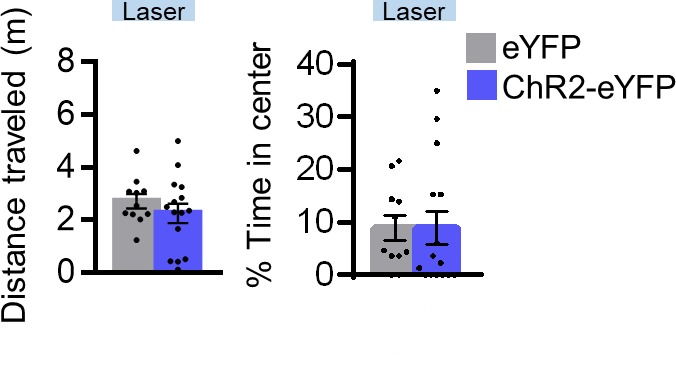
Figure 5—figure supplement 1. Assessment of locomotion and anxiety following 4 Hz photoactivation of rPL neurons.


