. 2018 May 31;7:e34469. doi: 10.7554/eLife.34469

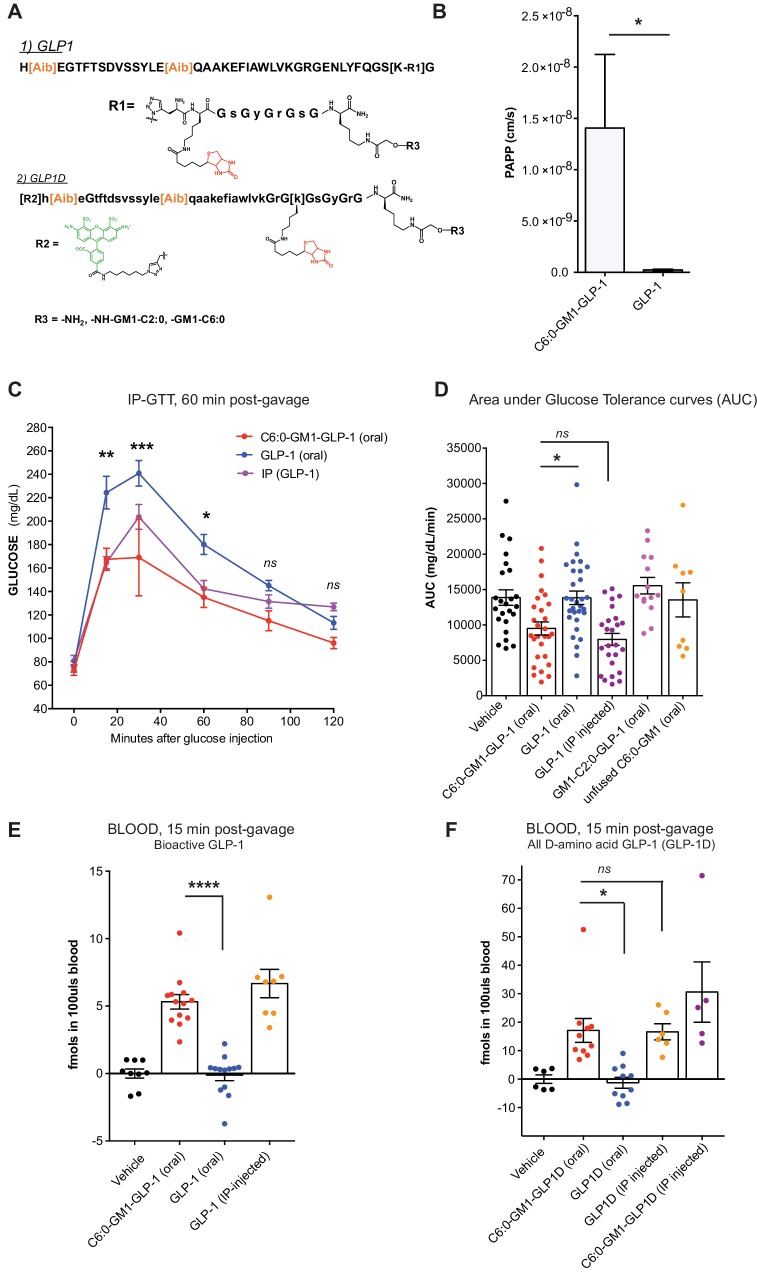
Figure 5. GM1-mediated absorption of GLP-1 affects blood glucose metabolism.

(A) GLP-1 and all-D GLP-1 isomer sequence used for coupling to a C6:0 and C2:0 GM1 ceramide species. (B) In vitro transcytosis assay with C6:0-GM1-GLP-1, or unfused GLP-1 across T84 cell monolayers (three independent experiments) (Unpaired t-test, *p<0.5). (C) Representative intraperitoneal glucose tolerance test after gastric gavage of 10 nmol/kg C6:0-GM1-GLP-1. Each point represents mean ± s.e.m (n = 4 mice). Mice fed C6:0-GM1-GLP-1 (red curve) show faster recovery after a glucose challenge in contrast to mice gavaged with unfused GLP-1 (blue curve) or vehicle (black curve) (D) Effect of the indicated GM1-GLP-1 species, GLP-1 alone, or vehicle on glucose tolerance quantified as Area under Curve (AUC) for 10 independent experiments with each data point representing individual mice and bar representing the mean ± s.e.m. (E) GLP-1 in blood 15 min after gastric gavage quantified for each species using the luciferase bioassay (fmols of compound per 100uls blood for three independent experiments). (F) Systemic absorption of an all D-isomer of GLP-1 used to directly measure the cargo in blood (three independent experiments). (A–E) Each data point on graphs represents individual mice and bars represent mean ± s.e.m. (ns = non significant, *p<0.5; ***p<0.0001, Tukey’s multiple comparison test).

Figure 5—source data 1. Source Data for Figure 5D.
Columns represent treatment groups. Groupings of rows represent data collected on the same day (independent experiments, exp 1–10). Every number is the total area under glucose tolerance curves per individual mice calculated using GraphPad PRISM 7.0 software. This AUC data (not corrected) was used to produce Figure 5D.
DOI: 10.7554/eLife.34469.014
Figure 5—source data 2. Source Data for Figure 5E.
Columns represent treatment groups. Groupings of rows represent data collected on the same day (independent experiments). Every number is fmols per 100uls blood calculated from GLP-1 or C6:0-GM1-GLP-1 bioactivity/luciferase curves for each individual mouse.
elife-34469-fig5-data2.xlsx (263.2KB, xlsx)
DOI: 10.7554/eLife.34469.015
Figure 5—source data 3. Source Data for Figure 5F.
Columns represent treatment groups. Groupings of rows represent data collected on the same day (independent experiments). Every number is fmols per 100uls blood calculated from standard curves per individual mouse (each measured is an average of two technical replicates (with variance well less than 10%).
elife-34469-fig5-data3.xlsx (199.5KB, xlsx)
DOI: 10.7554/eLife.34469.016

Figure 5.

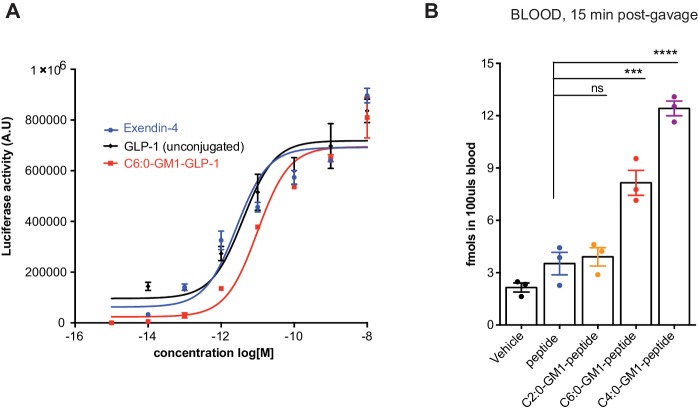
Figure 5—figure supplement 1. GM1-mediated absorption of GLP-1.

Figure 5—figure supplement 1.

(A) Representative luciferase assay confirming enzymatic activity of our C6:0-GM1-GLP-1 fusion compared to unfused GLP-1 and commercially available Exendin-4. (B) In vivo study showing absorption across intestinal epithelial barriers into blood after oral administration of the C6:0 and C4:0-GM1 peptide fusion compared to vehicle and the unfused reporter peptide. In contrast, the C2:0-GM1-peptide fusion is not absorbed.