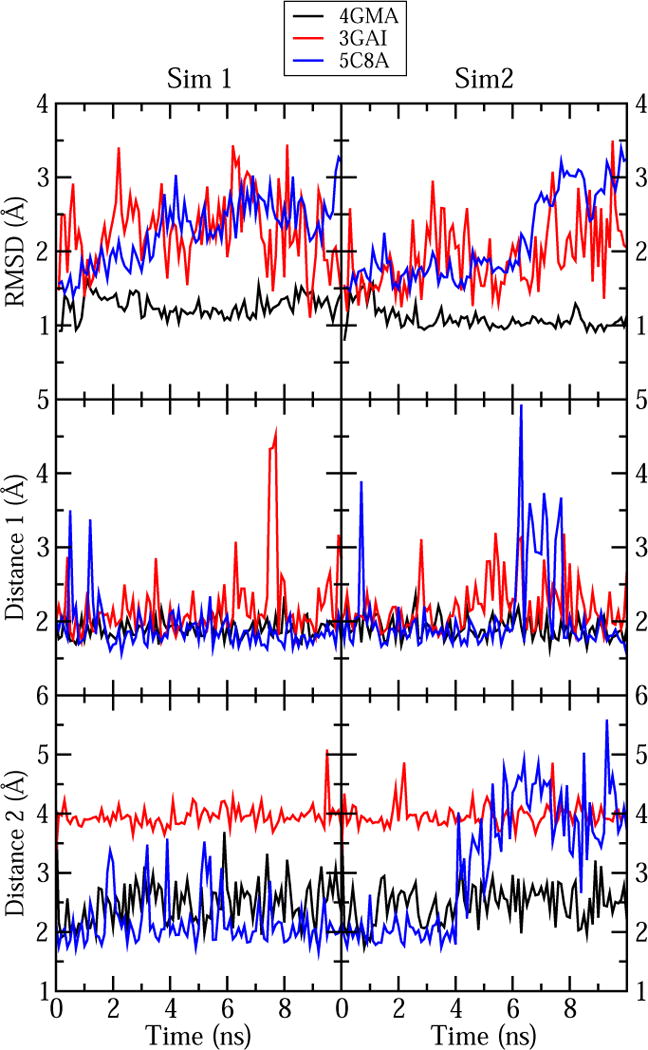
Figure 4.

Measurements of the cobalamin RMSD and the two selected distances in our simulations of cobalamin-containing proteins (see Table 9). The results of the first and the second simulation are shown in the left and right graphs, respectively. For 5C8A we only show the distances for chain A; see Figure S8 for the corresponding distances in chain B. Time 0 corresponds to the values in the X-ray crystal structures.
