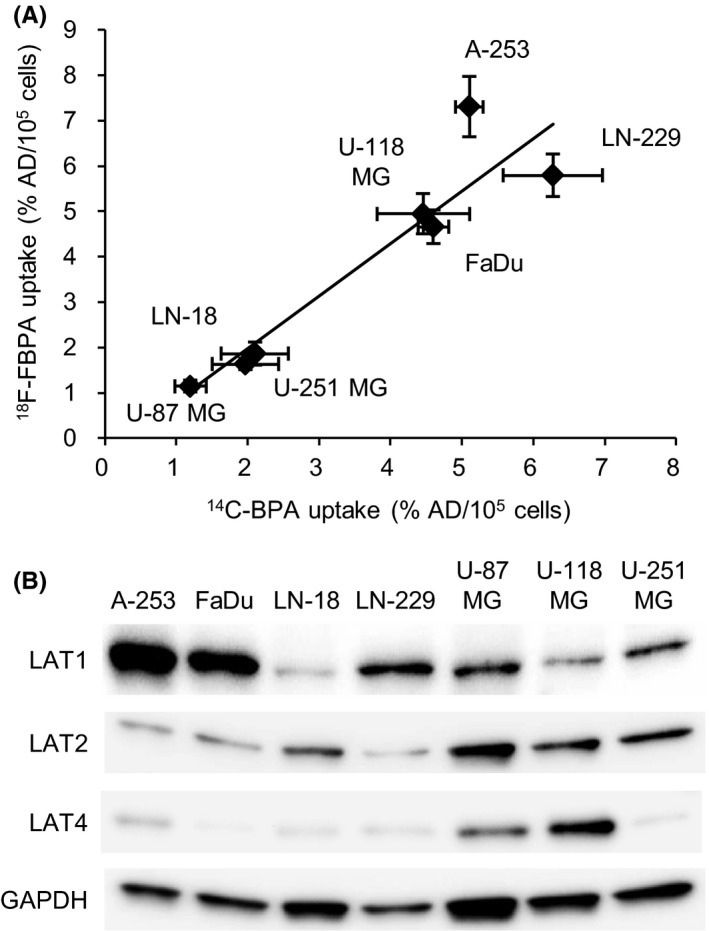
Figure 2.

A, Correlation between 14C‐4‐borono‐L‐phenylalanine (14C‐BPA) and 4‐borono‐2‐18F‐fluoro‐phenylalanine (18F‐FBPA) uptake levels in 7 tumor cell lines (r = .93, P < .01). Data are represented as the mean ± SD. B, Expression levels of amino acid transporters (LAT1, LAT2 and LAT4) in 7 tumor cell lines. %AD/105 cells, percentage of the administered dose per 105 cells
