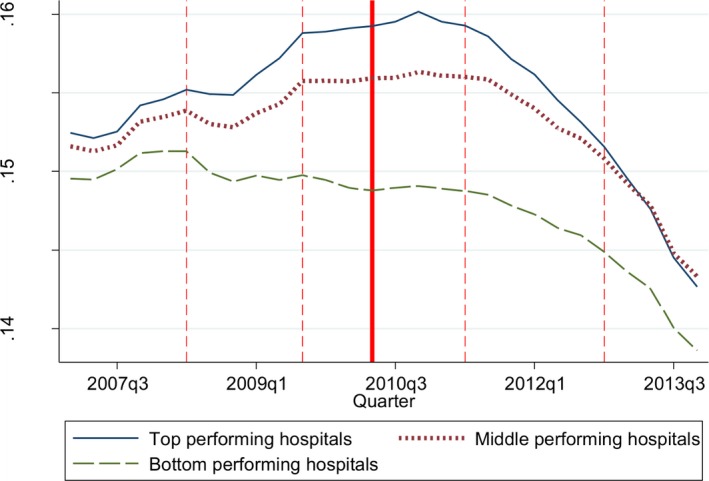
Figure 1.

- Notes. Our analysis includes 43,954,459 index admissions in 3,156 hospitals. To adjust for seasonal patterns in readmission rates, we plot the moving average readmission rates. For each quarter, we calculate the average of the readmission rates for two quarters before the present quarter, and one quarter after. The solid vertical line represents the second quarter of 2010, after passage of the Affordable Care Act. The dashed vertical lines represent (1) Q2 of 2008—proposed rule before CMS’s public reporting of readmission rates; (2) Q3 of 2009—start of CMS’s public reporting; (3) Q2 of 2011—proposed rule identifying the targeted conditions subject to financial penalties; and (4) Q4 of 2012—start of financial penalties. We divide hospitals into groups based on their slope change in the ratio of observed to predicted readmission rates for targeted conditions before and after the HRRP. The top performing hospitals include the top 25 percentile of hospitals in terms of their slope reductions in readmission rates for the targeted conditions before and after the HRRP. The middle performing hospitals are the middle 50 percentile of hospitals and the bottom performing hospitals are the bottom 25 percentile. Source: Authors’ analysis of 2007–2008 MedPAR Inpatient Research Identifiable Files and 2009–2013 100 percent Inpatient Standard Analytic Files.
