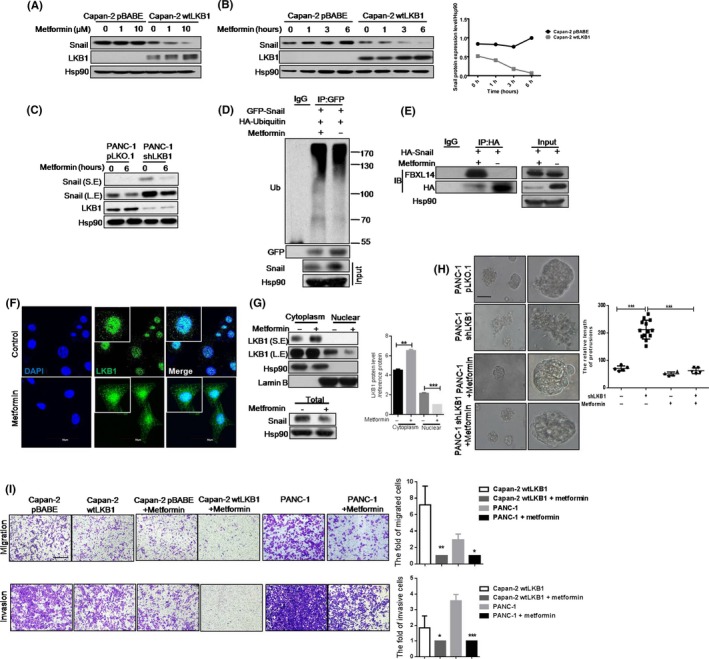
Figure 5.

Metformin suppresses migration and invasion by repressing Snail protein expression in LKB1‐dependent pathway in pancreatic cancer (PC) cells; A, B, Snail and LKB1 protein expression in Capan‐2 wtLKB1 and the control cell line. Cells were treated with metformin for 6 h (A) or 10 μmol/L metformin for the indicated time (B). The plot showed the relative ratio of Snial/Hsp90 in panel B; C, Snail and LKB1 protein expression in PANC‐1 shLKB1 and the control cell line. Cells were treated with 10 μmol/L metformin for the indicated time; D, Snail ubiquitination was analyzed by immunoprecipitation (IP) assay in HEK‐293T cells with or without 10 μmol/L metformin treatment; E, IP assay was conducted to detect the interaction between Snail and FBXL14 in HEK‐293T with or without 10 μmol/L metformin treatment; F, LKB1 location with or without 10 μmol/L metformin treatment in Capan‐2 wtLKB1 cell line. Scale bar, 50 μm; G, LKB1 protein expression in nuclear or cytoplasm in Capan‐2 wtLKB1 cell line with or without metformin treatment. Quantitative results are illustrated for panels (right). Data represent the mean ± SD (n = 3) from 3 separate experiments. **P < .01, ***P < .001, Student's t test; H, The acinar morphologies of PANC‐1 shLKB1 and the control cell line in 3‐D culture with or without metformin treatment. Quantitative results are illustrated for panels (right). Data represent the mean ± SD (n = 3) from 3 separate experiments. ***P < .001, Student's t test; I, Transwell assays were used to show the migration (5 × 10⁴ cells/well) and invasion (9 × 10⁴ cells/well) of Capan‐2 pBABE (or Capan‐2wtLKB1) and Capan‐2 pBABE (or Capan‐2 wtLKB1) with 10 μmol/L metformin treatment for 24 h. Quantitative results are illustrated for panels (right). Data represent the mean ± SD (n = 3) from 3 separate experiments. ***P < .001, **P < .01, *P < .05, Student's t test. Scale bars: transwell assay, 200 μm; 3‐D culture, 50 μm
