
Figure 2.
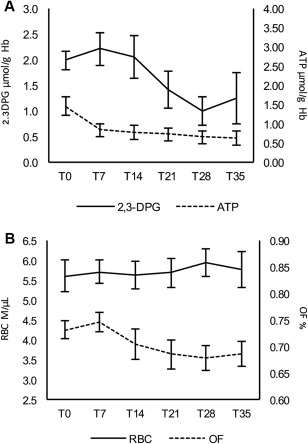
Mean levels at each observation time (T0, T7, T21, T28, T35) of 2,3‐diphosphoglycerate (µmol/g Hb) and adenosine triphosphate (A) and of total red blood cells count (M/μL) and mean osmotic fragility (OF) (%) (B); error bars show standard errors for each observation