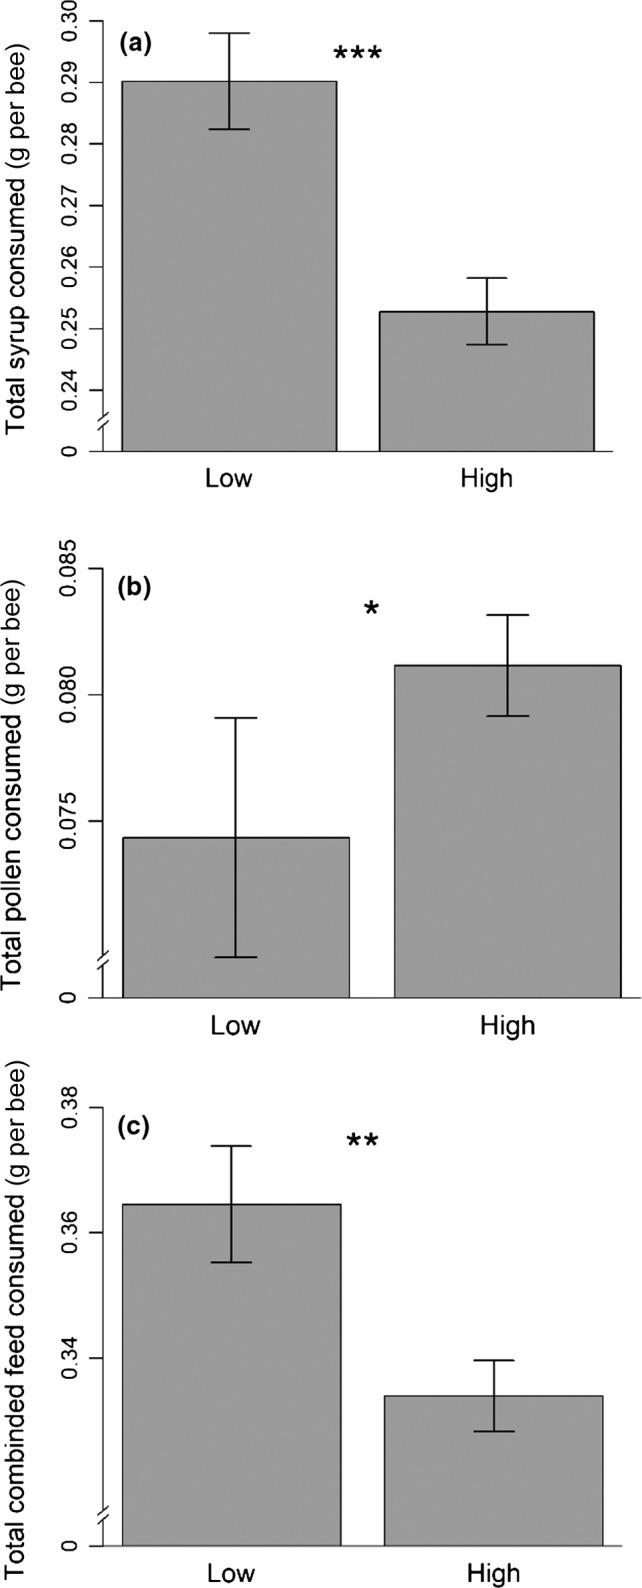
Figure 2.

Total consumption of syrup (a), pollen (b), and combined feed (c) (g per bee) by honeybees caged in high (60 bees, n = 15 cages) and low (6 bees, n = 8 cages) group densities, after 10 days. Cages, where spillages occurred, were not included. Error bars denote SEM, and stars show significant differences (*p < .05, **p < .01, ***p < .001)
