Figure 3.

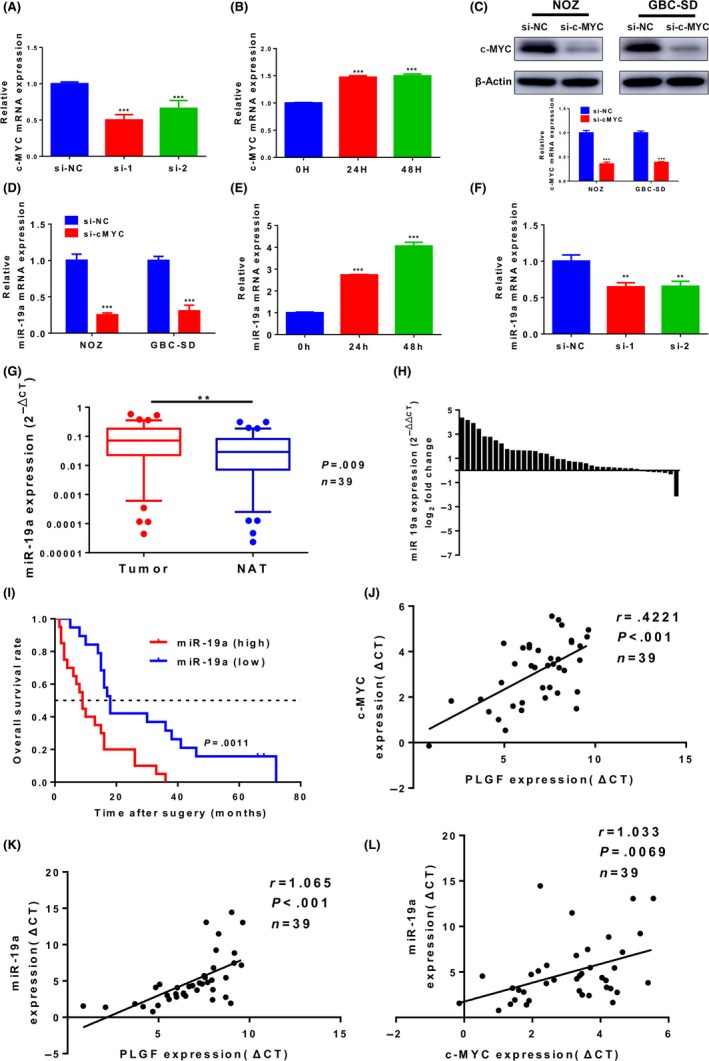
Placental growth factor (PLGF), c‐MYC, and microRNA‐19a (miR‐19a) form an axis in gallbladder cancer (GBC). A, Quantitative RT‐PCR analysis of c‐MYC levels in PLGF siRNA‐treated (si‐1 and si‐2) NOZ cells. ***P < .001. B, Quantitative RT‐PCR analysis of c‐MYC levels in exogenous PLGF‐treated GBC‐SD cells. ***P < .001. C, Quantitative RT‐PCR and Western blot analysis of c‐MYC in NOZ and GBC‐SD cells transfected with c‐MYC siRNA or negative control siRNA (si‐NC). ***P < .001. D, Quantitative RT‐PCR analysis of miR‐19a levels in NOZ and GBC cells transfected with c‐MYC siRNA or si‐NC. ***P < .001. E, Quantitative RT‐PCR analysis of miR‐19a levels in NOZ and GBC cells treated with 100 ng/mL PLGF for 0, 24, and 48 h. ***P < .001. F, Quantitative RT‐PCR analysis of miR‐19a levels in NOZ cells transfected with PLGF siRNA (si‐1 and si‐2) or si‐NC. **P < .01. G, Scatterplots of the relative expression levels of miR‐19a in 39 paired GBC tissues and their corresponding normal adjacent tissues (NAT). miR‐19a expression was calculated and expressed as the miR‐19a/U6 expression ratio (2−Δ CT); P = .009. H, miR‐19a expression in GBC tissues and NATs from the same 39 patients (quantitative RT‐PCR) (U6 as the internal control; Wilcoxon matched‐pairs test). I, Kaplan–Meier overall survival curve of GBC patients based on miR‐19a expression; P = .0011. J, Correlation between the expression levels of PLGF and c‐MYC was determined using linear regression analysis and paired t‐test with the same samples used (P < .001, r = .4221, n = 39; Pearson's correlation). K, Correlation between PLGF expression levels and miR‐19a (P < .001, r = 1.065, n = 39; Pearson's correlation). L, Correlation between the expression levels of c‐MYC and miR‐19a (P = .0069, r = 1.033, n = 39; Pearson's correlation)
