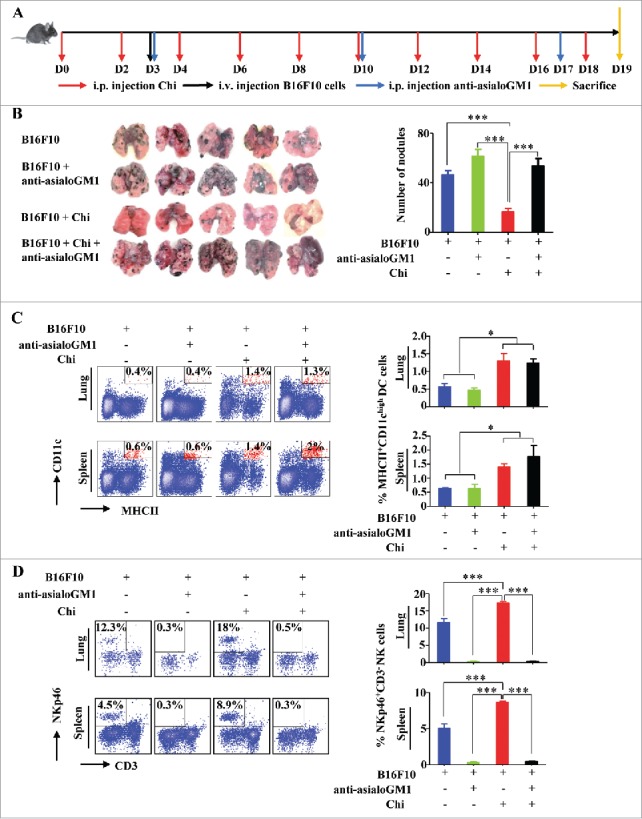
Figure 5.

Chitosan enhances the DC and NK cell response in vivo in the B16F10 melanoma mouse model. (A) Timeline for the in vivo experiment. (B) Gross appearance and quantification of tumor nodules in the lungs of B16F10 mice (n = 5). ***, P < 0.001. (C) Flow cytometric analysis and quantification of MHCII+CD11chigh DCs in spleen and lung tissues harvested from experimental and control groups. The left panels show the data from one representative mouse and summary data (n = 3) are shown on the right. *, P < 0.05. (D) Flow cytometric analysis and quantification of the relative proportions of NKp46+CD3e─ NK cells in spleen and lung tissues harvested from the experimental groups. The left panels show the data from one representative mouse and summary data (n = 5) are shown on the right. ***, P < 0.001. Data were analyzed by Student's t test and shown as mean ± SEM (B-D).
