
Figure 2.
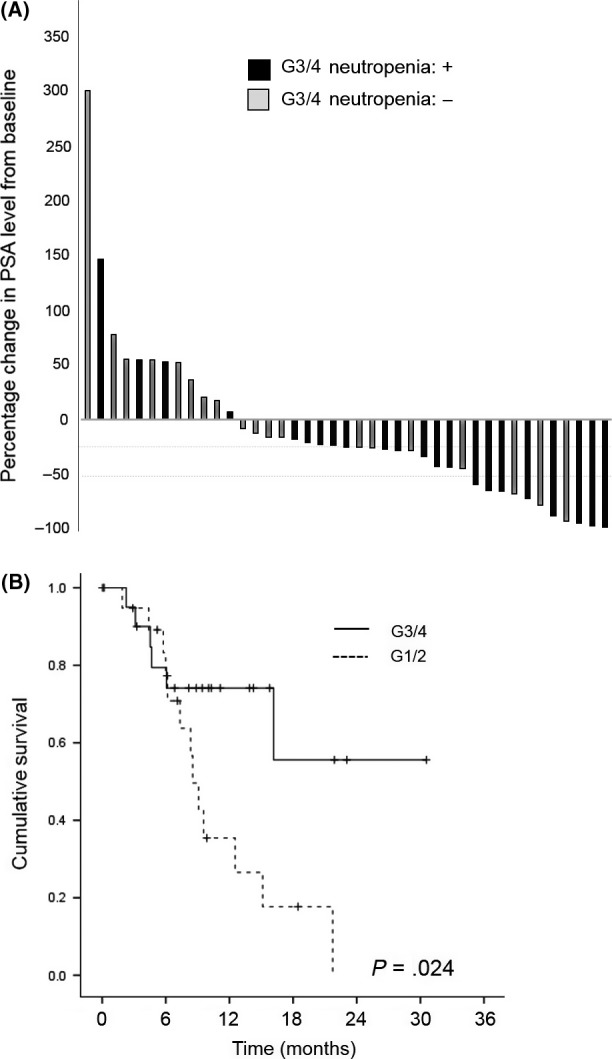
A, Waterfall plot of maximum percentage change in prostate‐specific antigen (PSA) level from baseline in the grade 3/4 (G3/4) specified population (n = 41). Black bar indicates the patients with G3/4 neutropenia. B, Kaplan‐Meier for time to overall survival in the grade 3/4 (G3/4) specified population (n = 41)