
Figure 3.
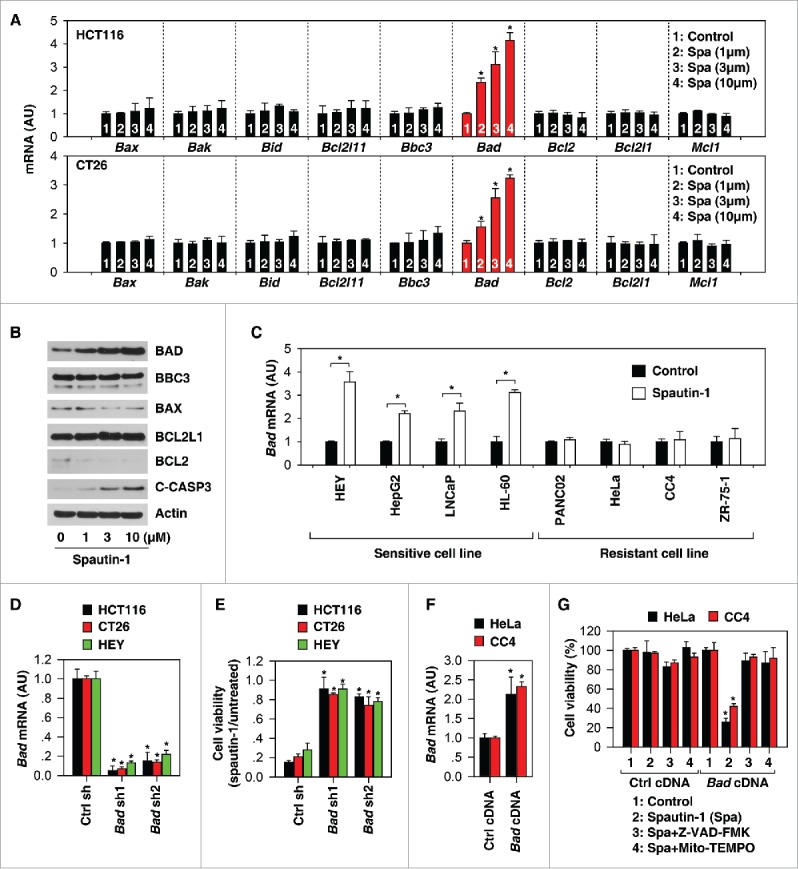
Upregulation of BAD facilitates spautin-1-induced apoptosis. (A) Q-PCR analysis of indicated gene expression in HCT116 and CT26 cells following treatment with spautin-1 (1, 3, and 10 µM) for 24 hours (n = 3, *p < 0.05 versus untreated group, unpaired t-test). (B) Western blot analysis of expression of indicated proteins in HCT116 cells following treatment with spautin-1 (1, 3, and 10 µM) for 24 hours. (C) Q-PCR analysis of Bad gene expression in indicated cancer cells following treatment with spautin-1 (10 µM) for 24 hours (n = 3, *p < 0.05 versus untreated group, unpaired t-test). (D) Q-PCR analysis of Bad gene expression in indicated Bad knockdown cancer cells (n = 3, *p < 0.05 versus control shRNA group, unpaired t-test). (E) Knockdown of Bad inhibited spautin-1-(10 µM) induced cell death in indicated cells (n = 3, *p < 0.05 versus control shRNA group, unpaired t-test). (F) Q-PCR analysis of Bad gene expression in indicated Bad knockin cancer cells (n = 3, *p < 0.05 versus control cDNA group, unpaired t-test). (G) Knockin of Bad increased spautin-1-(10 µM) induced cell death in HeLa and CC4 cells (n = 3, *p < 0.05 versus control cDNA group, unpaired t-test).