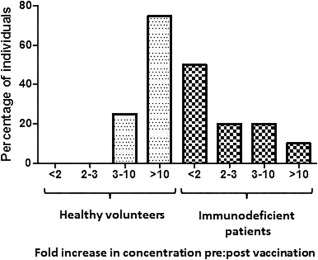
Figure 4.

The spectrum of individuals with different fold increases (FI) in concentration is different in those with antibody deficiency. The percentage of individuals with a FI < 2, 2–3, 3–10 and > 10 were compared between healthy individuals (n = 8) and individuals with antibody deficiency (n = 20).
