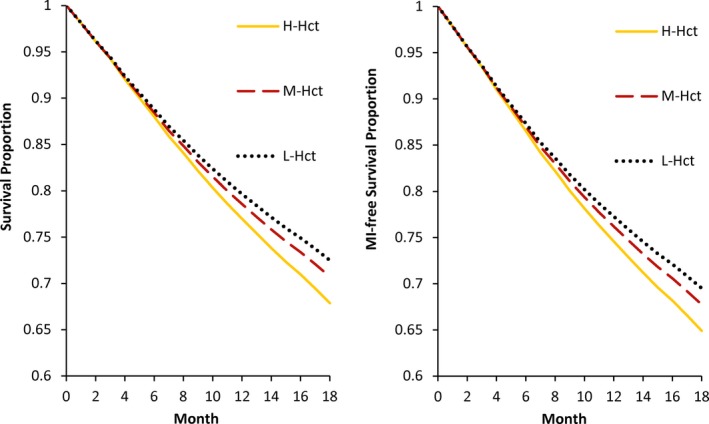
Figure 2.

Survival Curves and Myocardial Infarction (MI)‐Free Survival Curves under the Low‐Hematocrit (L‐Hct), Mid‐Hematocrit (M‐Hct), and High‐Hematocrit (H‐Hct) Strategies, United States Renal Database System 2006–2012 [Color figure can be viewed at http://wileyonlinelibrary.com]
