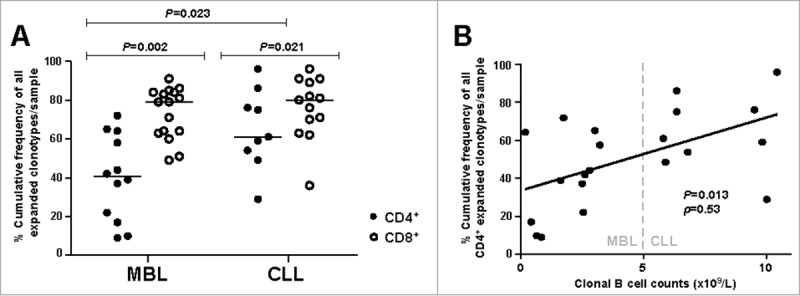
Figure 1.

Clonality analysis. A, Percentage cumulative frequency of all expanded CD4+ and CD8+ T cell clonotypes in MBL subjects and CLL-A(0) patients. Horizontal lines correspond to the median value for each case. B, Correlation between the absolute count of malignant B cells and the percentage cumulative frequency of all expanded CD4+ T cell clonotypes per sample. ρ: Spearman's rho correlation coefficient.
