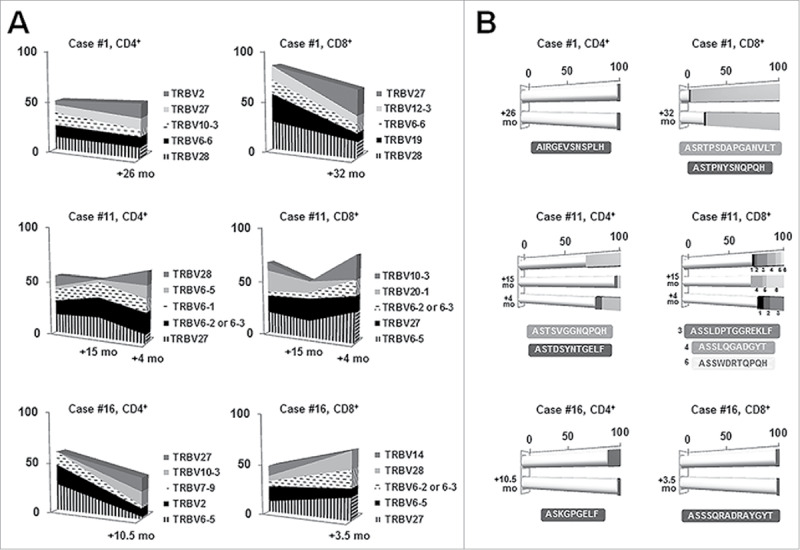
Figure 3.

Longitudinal analysis in three selected MBL cases for the CD4+ and CD8+ T cell fractions. Gene frequencies (A) were assessed considering clonotypes whereas clonality (B) was measured considering rearrangements. A, TRBV gene repertoire dynamics over time. Only the five most frequent genes are represented. Sequential time points are indicated in the x-axis whereas the frequency (%) of each gene is shown in the y-axis. B, Clonal fluctuations over time. Each horizontal bar illustrates a different time point. White cylindrical parts of the bars account for the different clonotypes among the distinct time points whereas darker cubic parts represent persistent clonotypes. The frequency (%) of each clonotype is shown along the x-axis. Clonotypes shared by different time points, as well as their CDR3 amino acid sequence, are depicted in the same color.
