
Figure 1.
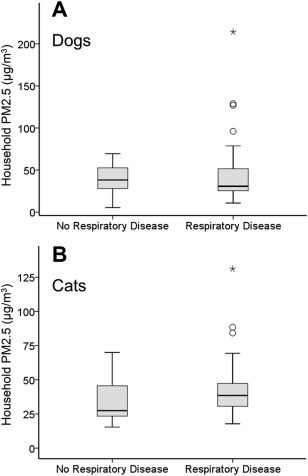
A, Distribution of household PM2.5 concentration for dogs without respiratory disease (n = 38) and dogs with respiratory disease (n = 83). The box represents the interquartile range (25th‐75th percentile). The horizontal line within each box represents the median. The whisker bars represent the highest and lowest values within 1.5 times of the interquartile range, the open circle indicates outlier that is more than 1.5 times the interquartile range, and the black star indicates extreme value that is more than 3 times the interquartile range. There was no statistical difference in household PM2.5 level between dogs without and with respiratory disease (P = .57). B, Distribution of household PM2.5 concentration for cats without respiratory disease (n = 17) and cats with respiratory disease (n = 64). Cats with respiratory disease lived in the households with significantly higher PM2.5 level compared to cats without respiratory disease (P = .017)