
Figure 3.
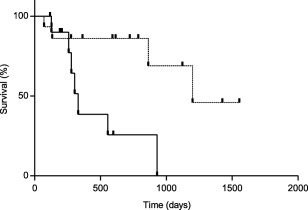
Kaplan‐Meier curve of OST in dogs with high NLR (n = 11; solid line) and dogs with low NLR (n = 15; dashed line). Dogs with high NLR had an OST of 330 days (range 117–930 days), whereas dogs with a low NLR had an OST of 1198 days (range 70–1554 days); P = .008. Vertical lines represent censored dogs