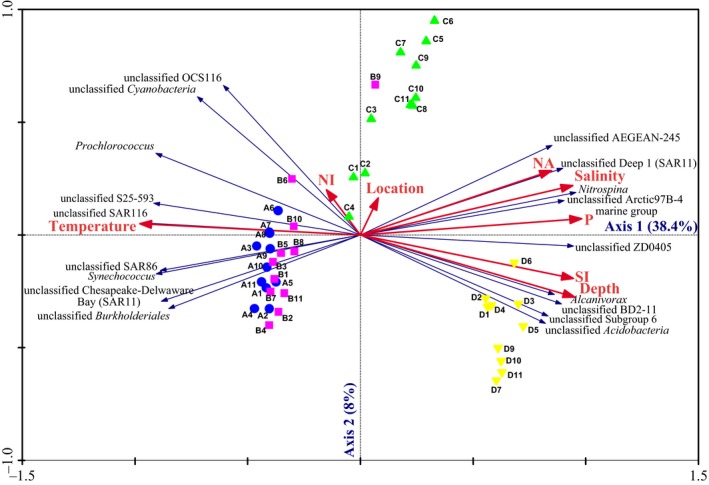
Figure 6.

Redundancy analysis ordination of community compositions and environmental variables. The triplot shows the relationship among the spatial and environmental variables, bacterial communities, and the specific bacterial genus components. Only specific bacteria genera with fit values >80% were shown in the triplot. NA, nitrate; NI, nitrite; P, phosphate; SI, silicate. (A) Represents 5 m depth; (B) represents 25 m depth; (C) represents 75 m depth; (D) represents 200 m depth; the numbers 1–11 represent the stations
