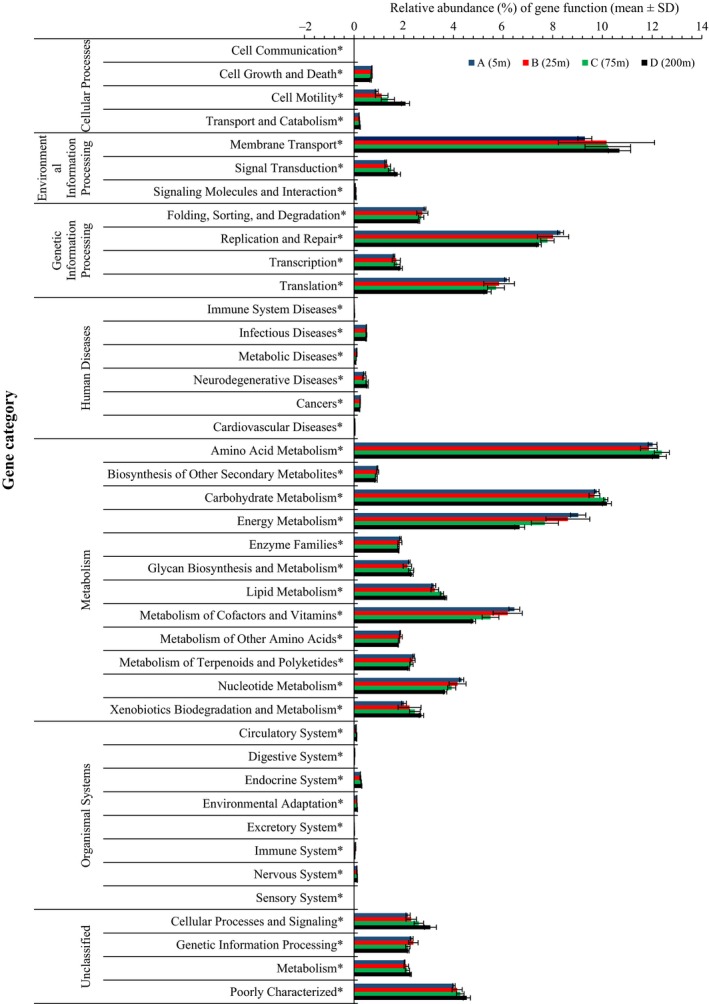
Figure 8.

Predicted functions of the epipelagic bacterial communities. The depth distributions of each class of the gene function (relative abundance, mean ± one standard deviation) across all 11 sampling stations are included. An asterisk indicates that the relative abundances of the functional categories are significantly different (Kruskal–Wallis test, p < .05) among the four depths
