
Figure 2.
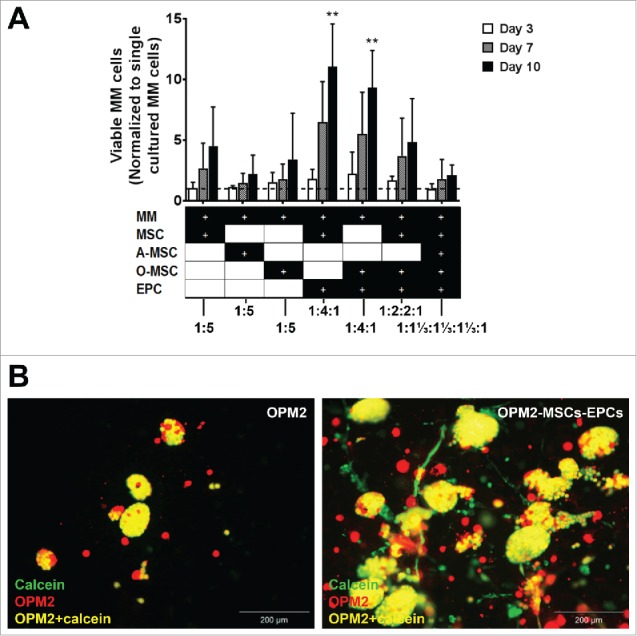
Expansion of (co-)cultured cell lines in a 3D BM niche model. (A) Number of viable co-cultured myeloma cell lines (cultured with MSCs, adipogenic MSCs (A-MSCs), osteogenic MSCs (O-MSCs) and/or EPCs) after 3, 7 or 10 days of culture, normalized to single cultured myeloma cell lines (n = 3). Dashed line represents single cultured myeloma cell lines. Statistical analysis compared all groups to the single cultured control group. ** = P < 0.01. (B) Fluorescent images of OPM2 cells (DiI, red) without supporting cells after 10 days of culture with added calcein-AM (green) and fluorescent images of OPM2 cells (DiI, red) with added calcein-AM (green) cultured with supporting MSCs and EPCs at day 10. Overlay of green and red appears yellow, demonstrating living OPM2 cells. The scale bar represents 200 µm.