Figure 5.
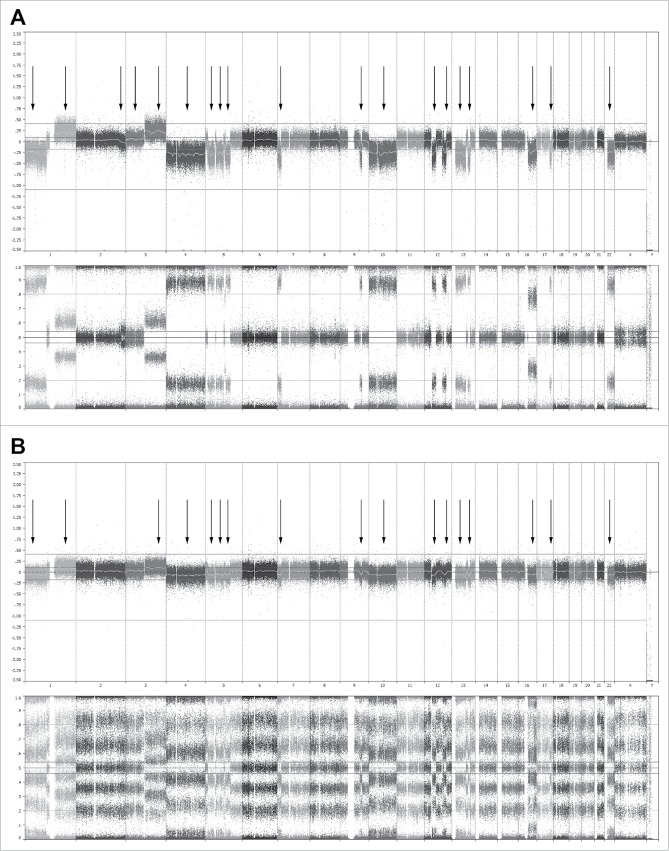
Whole genome analysis using single-nucleotide polymorphisms (SNP) mapping revealing gains and losses, as well as regions of loss of heterozygosity. (A) Genome overview showing the log2 R ratio (top) and B allele frequency (bottom) of the CD138+ cells of one representative donor at day 0 before co-culture. In the whole genome, 19 sites of gains and losses could be identified within this donor. (B) Genome analysis showing the log2 R ratio (top) and B allele frequency (bottom) of the CD138+ cells and supporting cells of the same donor at day 28. In the whole genome, 17 sites of gains and losses could still be identified, all corresponding with gains and losses present at day 0. All 17 gains and losses identified at day 28 were mosaic, with a presence of 80–85% at day 0. The 2 gains and losses no longer identifiably at day 28 were also mosaic at day 0, with a presence of 10–15%. Similar results were obtained for 2 other donors.

