
Figure 6.
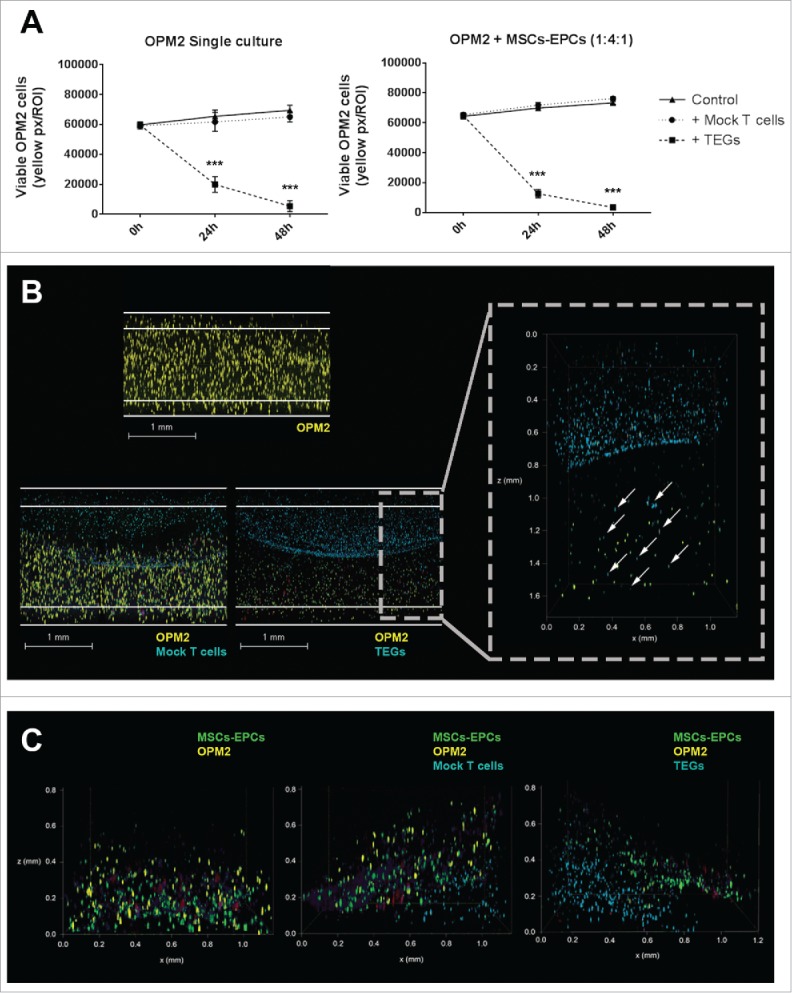
TEGs migrate and target OPM2 in a 3D BM niche model. (A) Left panel: quantification of viable OPM2 cells present in culture during 48 hours, untreated or after addition of either mock T cells or TEGs. Right panel: quantification of viable OPM2 cells co-cultured with MSCs and EPCs during 48 hours, untreated or after addition of either mock T cells or TEGs. Statistical analysis compared all groups to the non-treated control group. *** = P < 0.001. (B) Confocal 3D images of OPM2 cultures after 24 hours of culture, showing OPM2 (DiI, yellow), mock T-cells or TEGs (DiD, cyan) and apoptotic cells (Caspase-3, red). The scale bars represent 1 mm. A zoomed in confocal 3D image shows the migration of TEGs (DiD, cyan, indicated by white arrow) into the OPM2 culture (DiI, yellow) after 24 hours. TEGs can be found throughout the entire height of the Matrigel 50% (v/v) plug. (C) Confocal 3D images of OPM2 co-cultures after 24 hours of culture, showing OPM2 (DiI, yellow), mock T cells or TEGs (DiD, cyan), MSCs and EPCs (DiO, green) and apoptotic cells (Caspase-3, red).