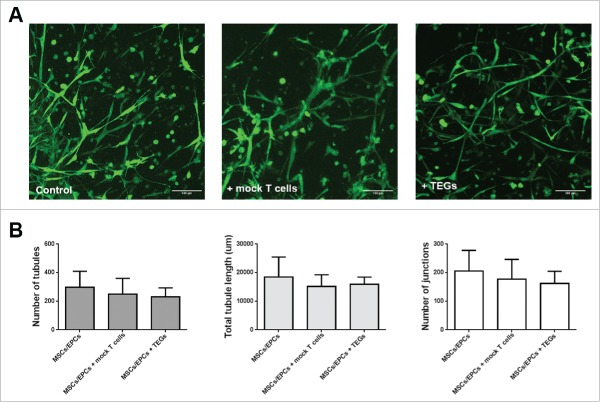
Figure 8.
Intact viable MSC/EPC networks in the 3D BM niche model, 48 hours after T-cell addition. (A) Fluorescent images of networks formed by MSCs and EPCs co-cultured with myeloma cells, in the control, mock T-cell and TEG condition (n = 6). Live cells in green (calcein); The scale bar represents 100 µm. (B) Analysis of the number of junctions, number of tubules or the total tubule length (µm) within the living MSC/EPC networks 48 hours after T-cell addition. There were no significant differences between the groups when analyzing different parameters of network formation.

