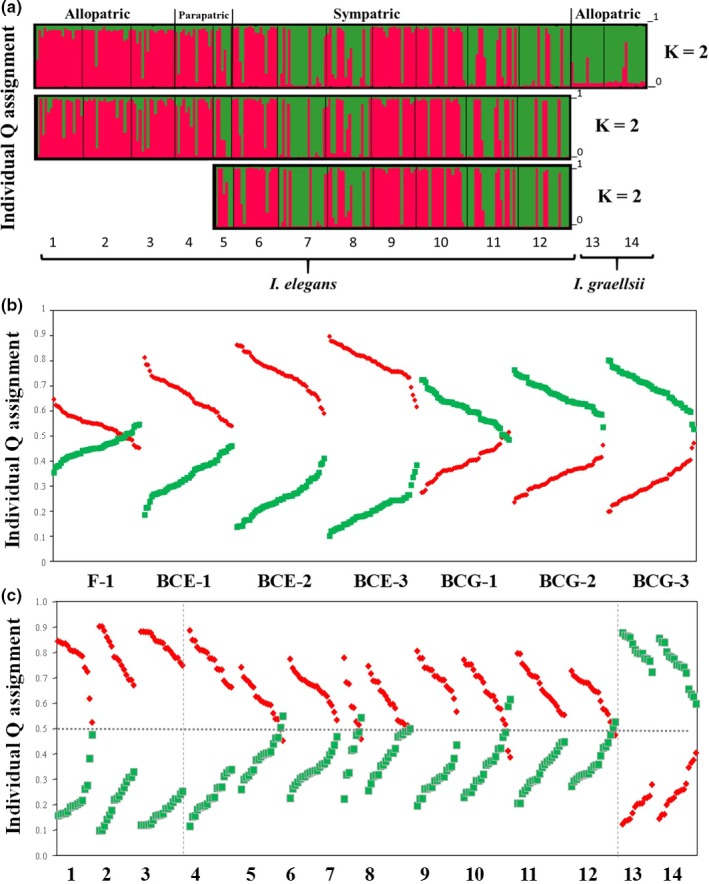
Figure 2.

Admixture analysis in structure. Panel A shows the estimated admixture proportion of each individual (±90% credible intervals) to the Ischnura elegans cluster. Each individual is represented by a single vertical line broken into two segments which are proportional to the estimated membership to each of the two genetic clusters [Q1 for I. elegans (black), and Q2 for Ischnura graellsii (gray)]. The A panel represents 237 genotypes of three allopatric (Liverpool, Kaiserslautern, and Gran Sasso, respectively), two parapatric (Vigueirat and Menorca), seven sympatric I. elegans populations (Estanyo de Europa, Amposta, Marjal del Moro, Arreo, Alfaro, Doniños, and Baldajo), and two allopatric I. graellsii populations (Ribeira de Cobres and Córdoba). Panel B represents admixture proportions for the 350 artificial hybrids generated with the program hybrid‐lab [first‐generation hybrid (F1; i.e., I. graellsii × I. elegans), first backcross with I. elegans (1EB; i.e., F1 × I. elegans), first backcross with I. graellsii (1GB; F1 × I. graellsii), second backcross with I. elegans (2EB; 1EB × I. elegans), third backcross with I. elegans (3EB; 2EB × I. elegans), and forth backcross with I. elegans (4EB; 3EB × I. elegans)]. Panel C represents individual admixture proportions (±90% credible intervals) of two parapatric populations, seven sympatric I. elegans populations, followed by the three allopatric I. elegans populations, and the two allopatric I. graellsii populations
