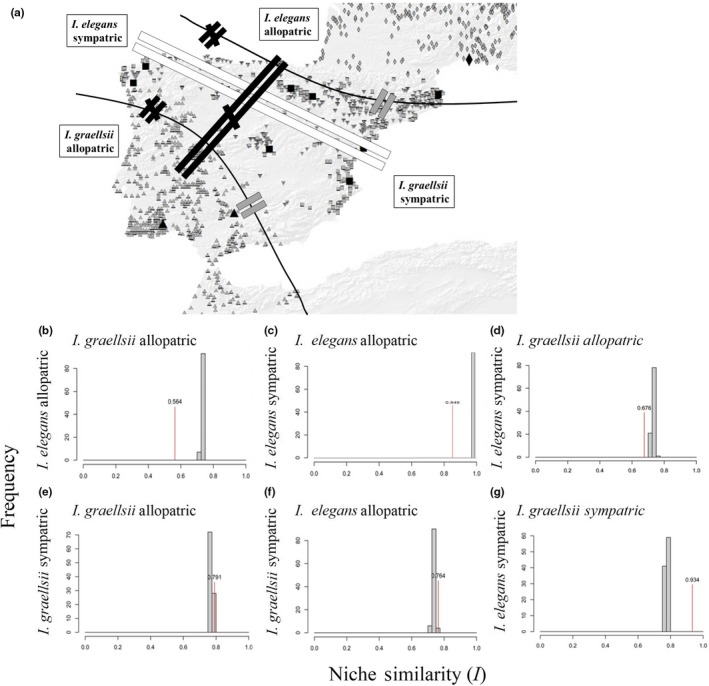
Figure 3.

Niche analyses. Results of background similarity test, showing modified Hellinger distance I. The observed similarity between niches is indicated with the red lines with Hellinger values on top, while histograms indicate the null distribution of ecological niche distance generated randomly. Hellinger distance I ranges from 0 (complete different) to 1 (identical). (a) Map of compared region niches (I. elegans from allopatry, I. elegans from sympatry, I. graellsii from allopatry, and I. graellsii from sympatry). Black unequal symbol indicates that niches are more different that by change; gray equal symbols indicate no differences between niches, and white equal symbol indicates that niches are more equal than by change. (b–d) The observed similarities were lower than their respective null distribution for random niche models. (e and f) The observed similarities were similar that their respective null distribution for random niche models. (g) The observed similarities were higher than their respective null distribution for random niche models
