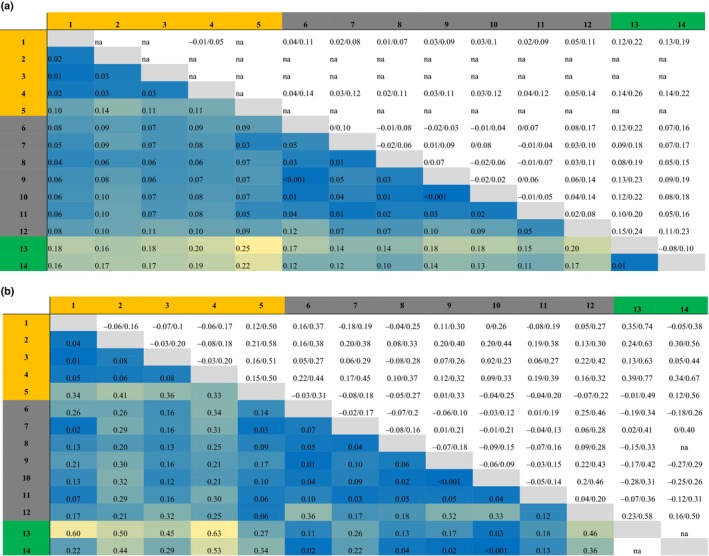
Table 2.
Differentiation between I. elegans populations with Weir and Cockerham's F ST shown in (A) and Jost's DEST in (B) in the lower diagonal with the blue and yellow shading indicating the F ST and DEST values (high values are yellow shaded, and low values have dark blue shading). The upper diagonal shows the ±95% confidence intervals. Populations are denoted by numbers (1 = Kaiserslautern, 2 = Gran Sasso, 3 = Liverpool, 4 = Vigueirat, 5 = Menorca, 6 = Doniños, 7 = Arreo, 8 = Baldajo, 9 = Alfaro, 10 = Estanyo de Europa, 11 = Amposta and 12 = Marjal del Moro, 13 = Córdoba and 14 = Ribeira de Cobres). Populations are colored according to their ecology, with all allopatric I. elegans populations in orange, the introgressed I. elegans populations in dark gray, and the two I. graellsii populations in green

