
Figure 6.
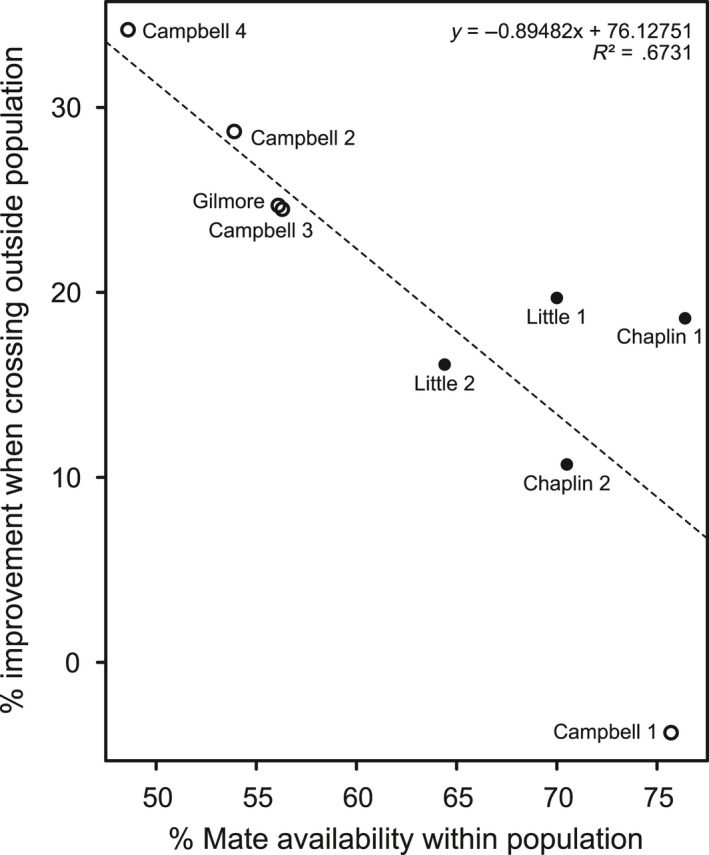
Scatter plot of experimental mating success within nine study populations and improvement of mating success when crossing the population with others. Empty circles indicate tetraploids, black circles hexaploids
Official websites use .gov
A
.gov website belongs to an official
government organization in the United States.
Secure .gov websites use HTTPS
A lock (
) or https:// means you've safely
connected to the .gov website. Share sensitive
information only on official, secure websites.
Scatter plot of experimental mating success within nine study populations and improvement of mating success when crossing the population with others. Empty circles indicate tetraploids, black circles hexaploids