
Figure 3.
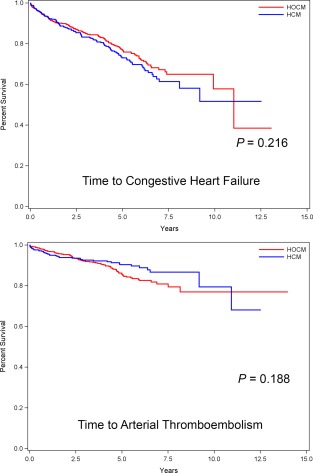
Kaplan‐Meier survival curves estimating percentage of 430 cats with nonobstructive (HCM) compared with 578 cats with the obstructive (HOCM) form of hypertrophic cardiomyopathy that have not yet experienced morbidity (Y‐axis) from CHF (top) or ATE (bottom) against time (X‐axis)