
Figure 2.
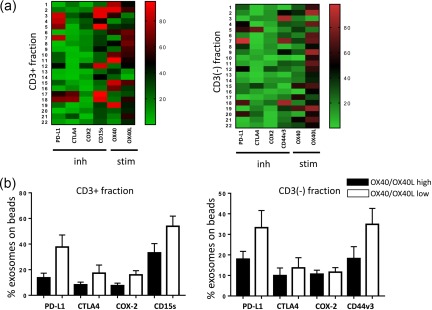
(a) Heat‐maps showing normalized values for positive exosome–bead complexes in each patient. As values for CD15s and OX40 are higher in the CD3(+) than those in the CD3(–) fraction, brighter colours are visible in the CD3(+) heat‐map. Patients with higher levels of inhibitory factors show low expression of stimulatory factors and vice versa. The ‘low’ versus ‘high’ levels of markers were defined by determining the mean values for all patients' exosomes and dividing all results into the < mean or > mean groups. (b) The percentages of positive exosomes on beads carrying low or high levels of OX40/OX40L in CD3(+) and CD3(–) exosome fractions indicate the reverse high/low relationship between the inhibitory and stimulatory exosomal markers. Inh = inhibitory proteins; stim = stimulatory proteins. [Colour figure can be viewed at http://wileyonlinelibrary.com]