Figure 2.

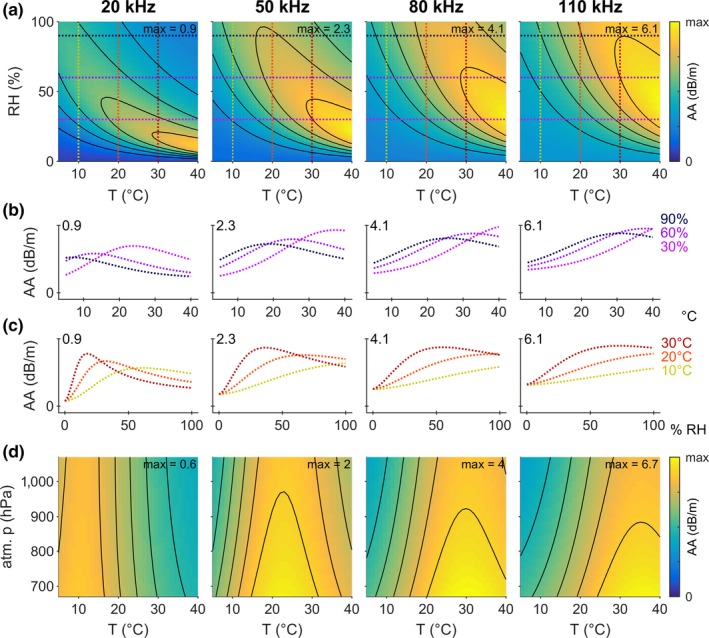
Atmospheric attenuation of sound in air (AA, separately for sound frequencies of 20, 50, 80 and 110 kHz, from left to right) varies with frequency, temperature, relative humidity and atmospheric pressure. (a) AA (color‐coded) as a function of temperature and relative humidity. Note the varying scaling of the color‐code for AA, with its maximum value given in the upper right corner of each panel. Black contour lines are drawn at equidistant and constant values of AA. Horizontal and vertical dotted colored lines indicate the cross‐sections shown in b and c. Atmospheric pressure was set to 1013.25 hPa. (b) AA as a function of temperature, shown for three relative humidities (30%, 60%, 90%, see dotted colored lines in a). Note the different scaling of the y‐axes matching the color code in a. (c) AA as a function of relative humidity, shown for three temperatures (10, 20, 30°C, see dotted colored lines in a). Note the different scaling of the y‐axes matching the color code in a. (d) AA (color‐coded) as a function of temperature and atmospheric pressure. Note the varying scaling of the color‐code for AA, with its maximum given in the upper right corner of each panel. Black contour lines are drawn at equidistant and constant values of AA. Relative humidity was set to 70%. For comparison, Figure S2 presents the same data with equal scaling of the color‐code and y‐axes, showing better the differences in AA with frequency instead of with T and RH
