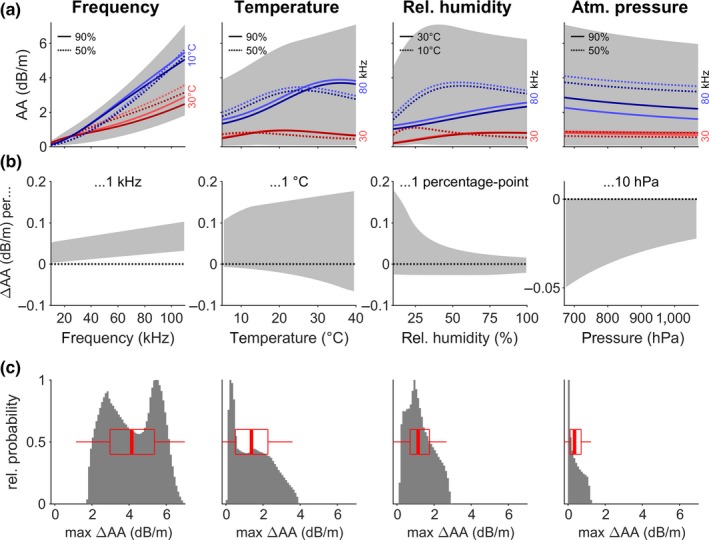
Figure 3.

Variation in atmospheric attenuation (AA) caused by sound frequency, temperature, relative humidity, and atmospheric pressure (from left to right). (a) Total range of AA (gray area) due to variation in the remaining three parameters when the parameter on the x‐axis is known. The colored lines are exemplary traces of AA for exemplary values of the remaining three parameters (exemplary values are: f = 30 or 80 kHz, T = 10 or 30°C, RH = 50% or 90%, and p = 880 or 1,060 hPa). The specific values used per line are indicated by color and line style: The parameter with the strongest effect is coded in red and blue, and the next parameter by line style. The third parameter with least effect is coded as brighter or darker color: p for the first three panels (bright: 880 hPa, dark: 1,060 hPa) and RH for the last panel (bright: 50%, dark: 90%). (b) Total range of AA‐change (derivative of AA, gray area) when the value on the x‐axis increases by a set amount (see panel title) and for all possible values of the remaining three parameters. ΔAA is always positive for increasing f, negative for increasing p, and positive and negative for increasing T and RH. (c) Histogram of the maximum variation in AA caused by maximum variation in one parameter, while all other parameters are kept constant, for all combinations of constant parameters. Box plots show median, quartiles and whiskers at up to 1.5 times the interquartile range beyond the quartiles. Variation in f causes the largest variation in AA, followed by T and RH, and concluded by p causing the smallest variation
