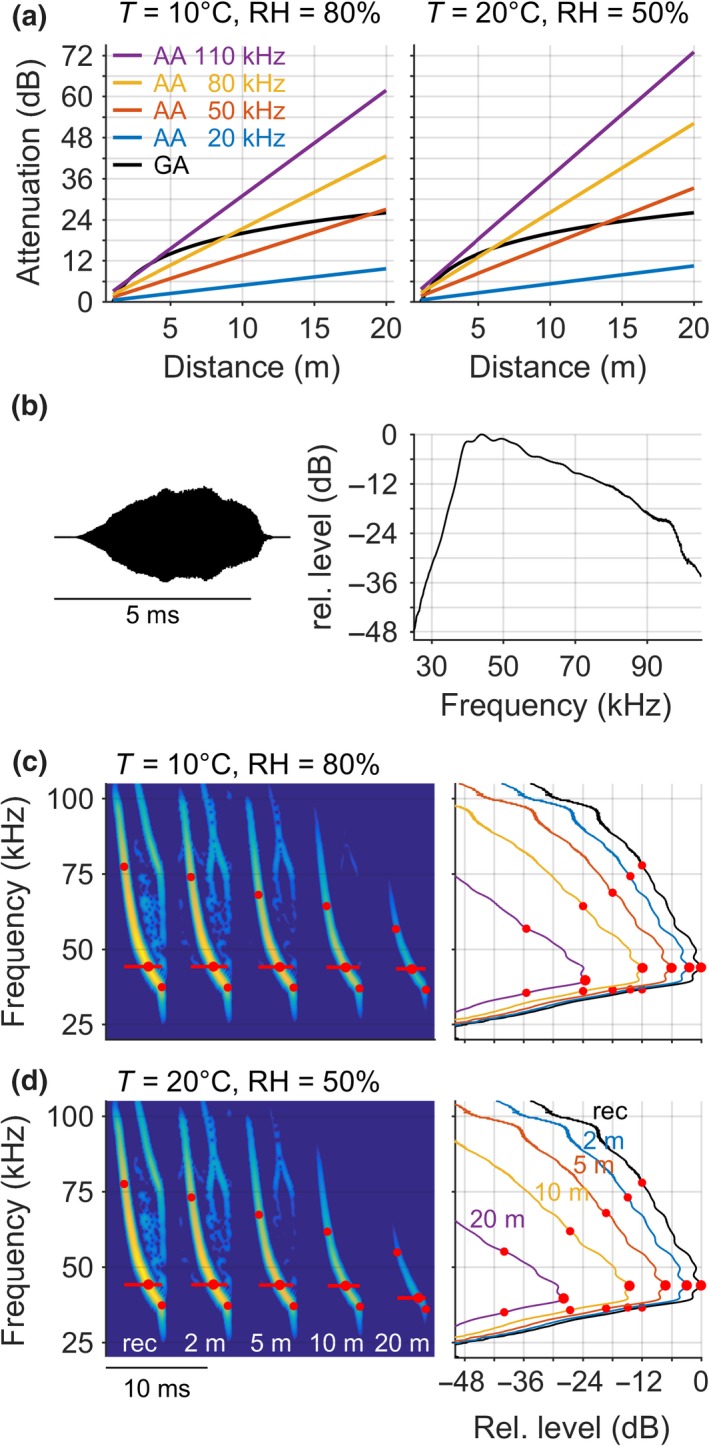
Figure 4.

Effect of atmospheric and geometric attenuation on call level and call frequencies. (a) Geometric attenuation (black) and atmospheric attenuation for different frequencies (colored lines) as a function of increasing distance between bat and microphone, for two different weather conditions (left and right). (b) Waveform (left) and amplitude spectrum (right) of a typical frequency‐modulated call of a Myotis bat, recorded close to the bat at about 1 m distance. (c,d) Effect of atmospheric attenuation on measured call frequencies: spectrogram (left) and spectra (right) of the recorded call (rec) and after additional atmospheric attenuation over 2, 5, 10, and 20 m distance (colored lines), for two different weather conditions. Note how the peak frequency, the −12 dB call frequencies (red dots) and call duration (red horizontal lines, based on −12 dB threshold) are reduced with increasing distance. Geometric attenuation was disregarded. Slight differences exist in the exact peak frequencies measured in the spectrogram or spectrum, but the pattern is the same
