Figure 1.

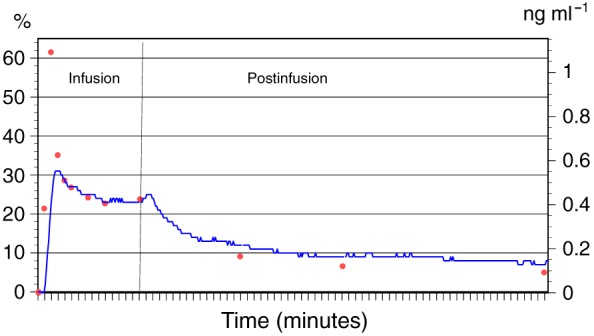
Mean dexmedetomidine plasma concentrations (red dots, right‐hand axis) and mean percentage change in analogue‐to‐digital converter units (blue line, left‐hand axis) during dexmedetomidine infusion and for 60 min after the infusion

Mean dexmedetomidine plasma concentrations (red dots, right‐hand axis) and mean percentage change in analogue‐to‐digital converter units (blue line, left‐hand axis) during dexmedetomidine infusion and for 60 min after the infusion