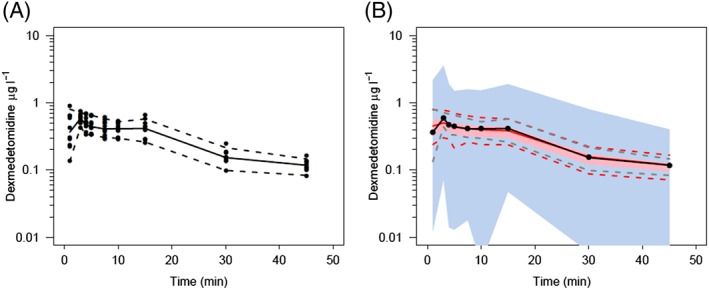
Figure 3.

Visual predictive check for the pharmacokinetic model. All plots show median and 90% confidence intervals (solid and dashed lines, respectively). (A) Prediction‐corrected observed concentrations. (B) Prediction‐corrected percentiles (10%, 50% and 90%) for observations (black dashed lines) and predictions (pink dashed lines), with 95% confidence intervals for prediction percentiles (median, pink shading; 5th and 95th percentiles, blue shading). There is a mismatch between the observed and predicted concentrations in the first 2 min
