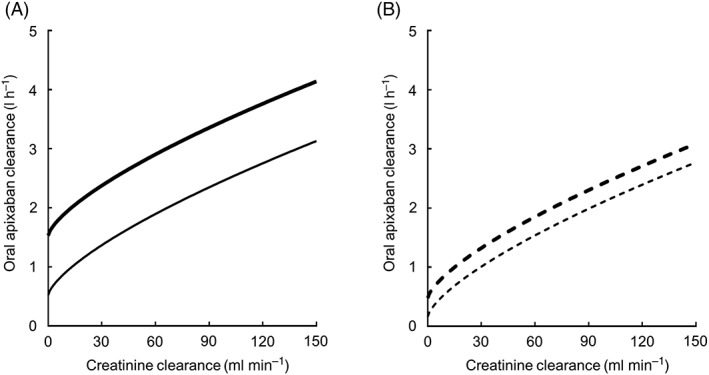
Figure 1.

Correlation between the population mean estimates of both oral apixaban and creatinine clearance in the final model. In panel A, the thick and thin lines indicate the population mean estimates for a typical patient with the CYP3A5*1/*1 and ABCG2 421C/C or C/A genotype, and for a typical patient with the CYP3A5*1/*1 and ABCG2 421A/A genotypes, respectively. In panel B, the thick dotted and thin dotted lines indicate the population mean estimates for a typical patient with the CYP3A5*1/*3 or *3/*3 and ABCG2 421C/C or C/A genotype, and for a typical patient with the CYP3A5*1/*3 or *3/*3 and ABCG2 421A/A genotypes, respectively
